· 12 min read · Jonathan Chrisnaldy
What the Bank Sees When It Looks at You
You fill in thirty boxes about your life and a lender turns you into one yes-or-no number. This synthetic dataset ships the formula behind its own answers, so for once we can read the rulebook, and it is not weighing the thing you think it is.
Somewhere in an application form, you stop being a person. You start as one: a name, an age, a job you can describe, a reason you need the money. Then you fill in the boxes. Annual income. Credit score. How much you already owe. How long since your last default. Thirty-odd fields, each one a small confession, and at the bottom a decision that arrives without a face: approved, or not. You never see the formula. You only see the verdict, and you spend the days before it worrying about the one number you have been taught to guard, your credit score.
I got to read the formula. The dataset behind this piece is synthetic, twenty thousand fictional loan applicants, and it does something real datasets almost never do: it ships the generator script that spells out its own rules. That script is the rulebook. It lays out, in plain code, exactly how these applicants are approved or denied, how their interest rates are set, how their risk is scored. So this is not an exposé of any real bank. It is a chance to open up one automated lender, a toy one, and see what it actually weighs. And the first thing you learn is that it barely looks at the number you were losing sleep over.
What the decision actually weighs
Rank every field by how strongly it moves the approval decision, and a clear winner falls out.
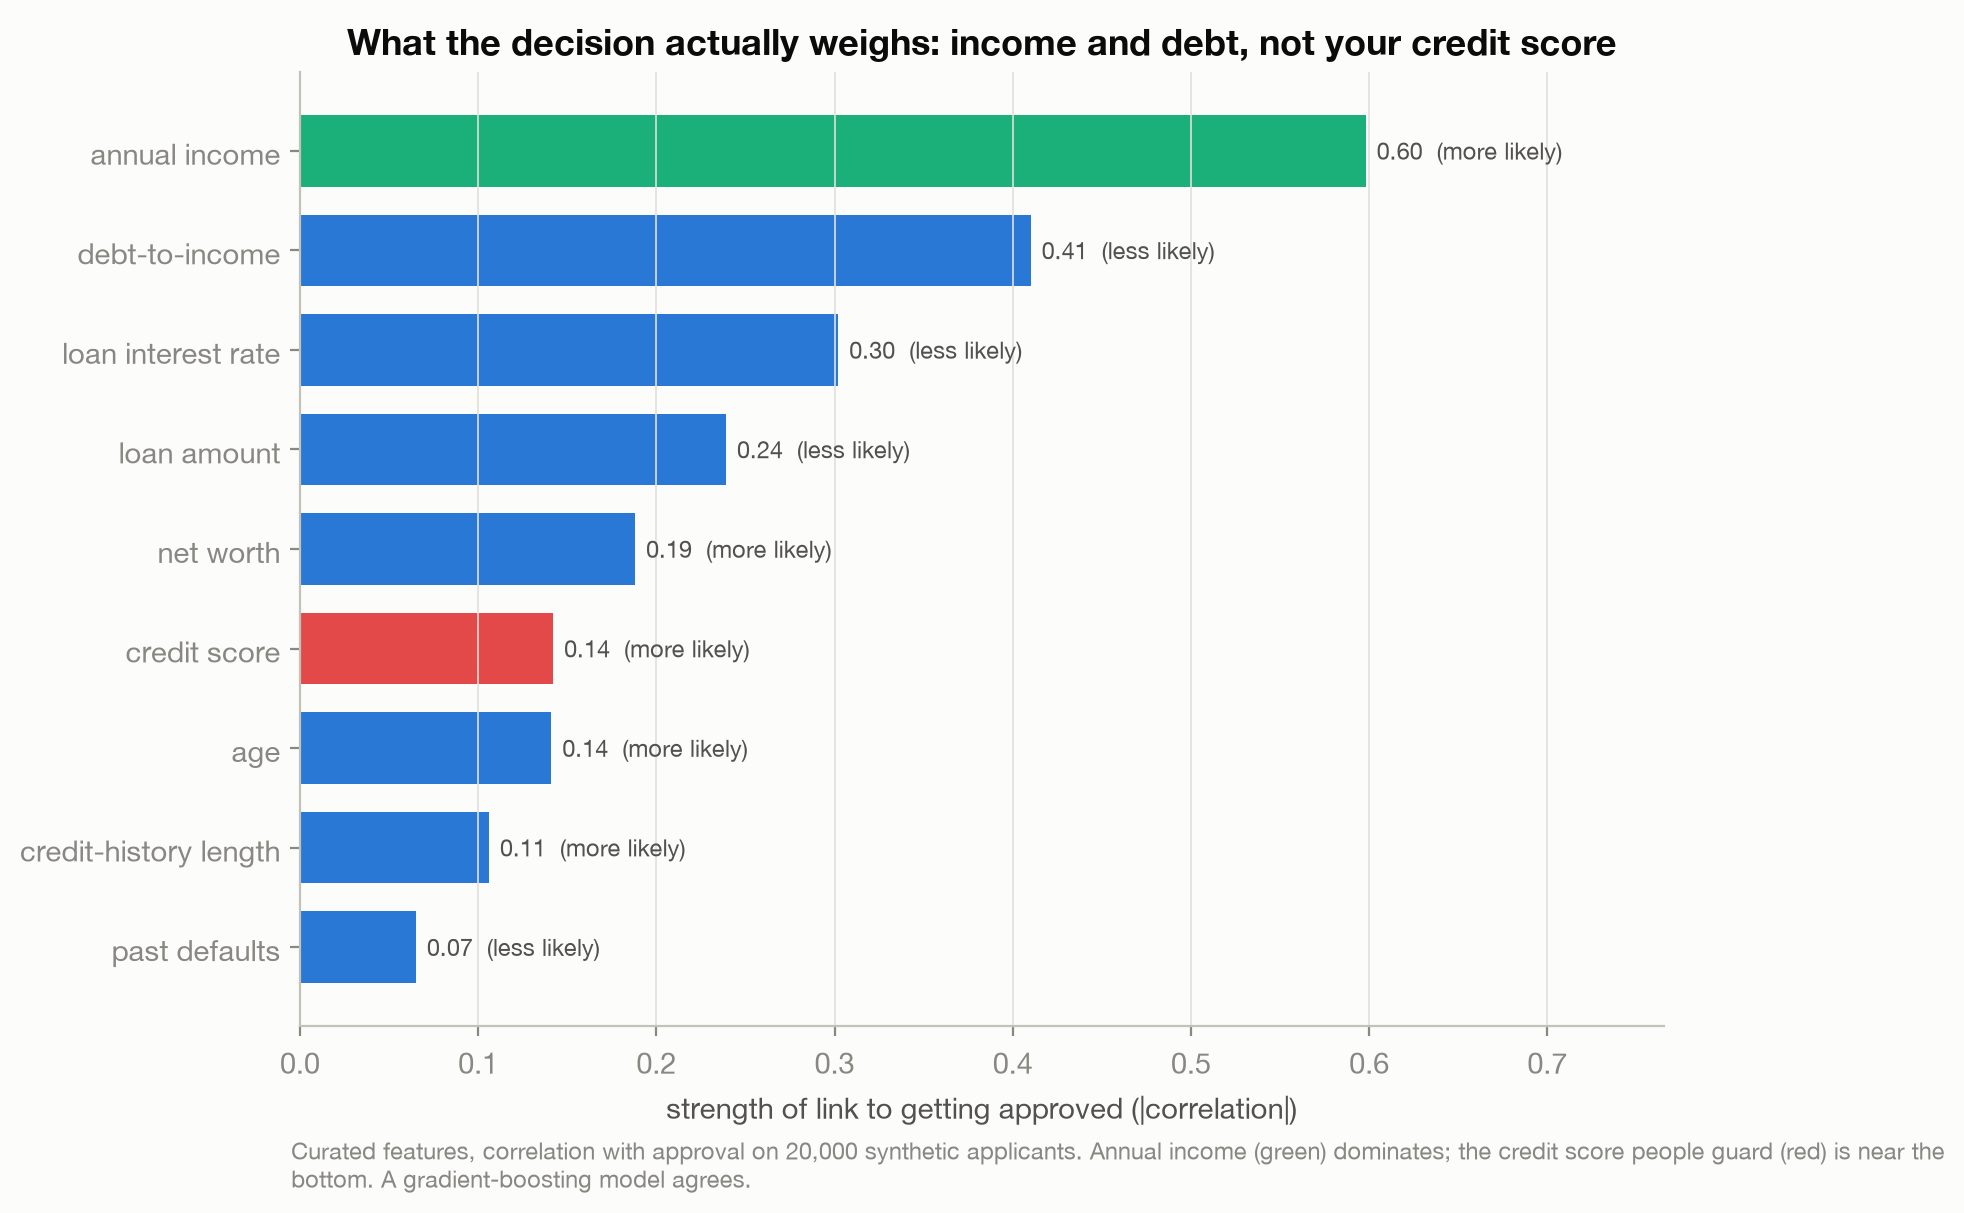
Annual income leads by a distance, with a correlation of about 0.60 with getting approved. Then debt-to-income, then the interest rate on the loan, then how much you asked for. Your credit score sits near the bottom of the pile, at about 0.14, barely ahead of your age. A machine-learning model, asked which fields it leans on to predict the decision, agrees: it puts debt-to-income, the interest rate, and income at the top, and ranks the credit score sixth. Only about a quarter of applicants are approved at all, and what separates them is mostly whether they earn a lot and owe a little. The credit score you were told to protect is a bit player.
That is worth sitting with, because the credit score has a whole folklore around it. We check it, we nurse it, we treat it as the verdict on our financial character. In this rulebook it is almost none of those things. So what is it doing?
Your credit score prices you more than it judges you
Start with how little the score moves the actual yes-or-no. Its correlation with approval is just 0.14, a faint nudge. What the score moves, strongly and cleanly, is your price. In the generator, the interest rate you are offered is mostly a function of your credit score: a better score buys a lower rate, almost mechanically.
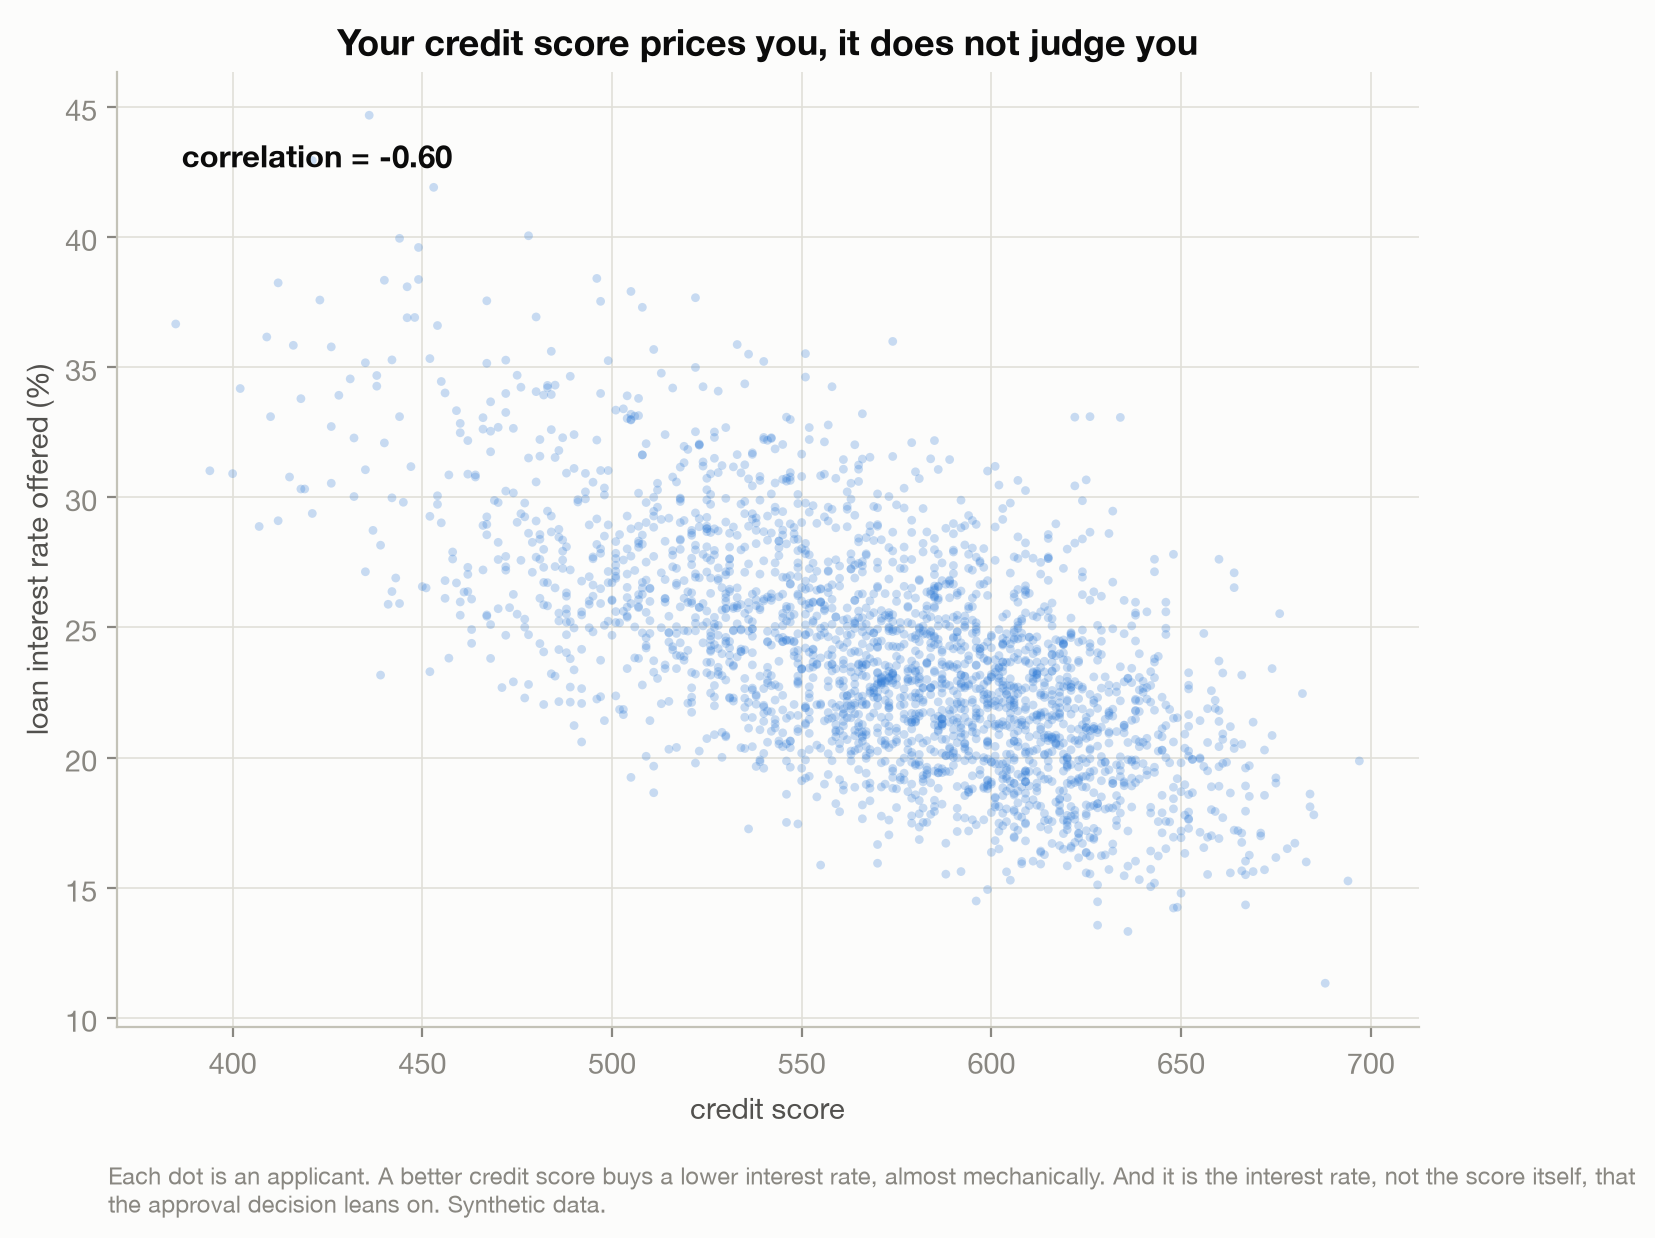
The correlation between credit score and the interest rate offered is about minus 0.60, and you can see it as a downward slope: score goes up, rate comes down. So the score’s biggest, cleanest consequence is not whether you are approved. It is how much the loan will cost you.
Why does it barely move approval, when we treat it as the whole verdict? Because the rulebook pushes your score two ways at once. On one line of the formula a higher score counts slightly against you, a quirk of how this thing was built. Then the lower interest rate that same score earns you counts in your favor on another line, and the two very nearly cancel. What is left is very little. Whatever else it shows, the number we lose sleep over is doing far more work as a price tag than as a gate.
That is a different mental model than most of us carry. We think a good credit score gets us approved. In this rulebook a good credit score mostly gets us a cheaper loan. Once you see it that way, the thing to guard is not a three-digit badge of worth, it is the cost it quietly assigns you.
A choice with no risk story
Now the part that should make you uneasy. Some of what the rulebook weighs has nothing to do with whether you will repay. The cleanest example is the calendar. Sort the applicants by the month they applied, and a pattern appears that cannot possibly be about them.
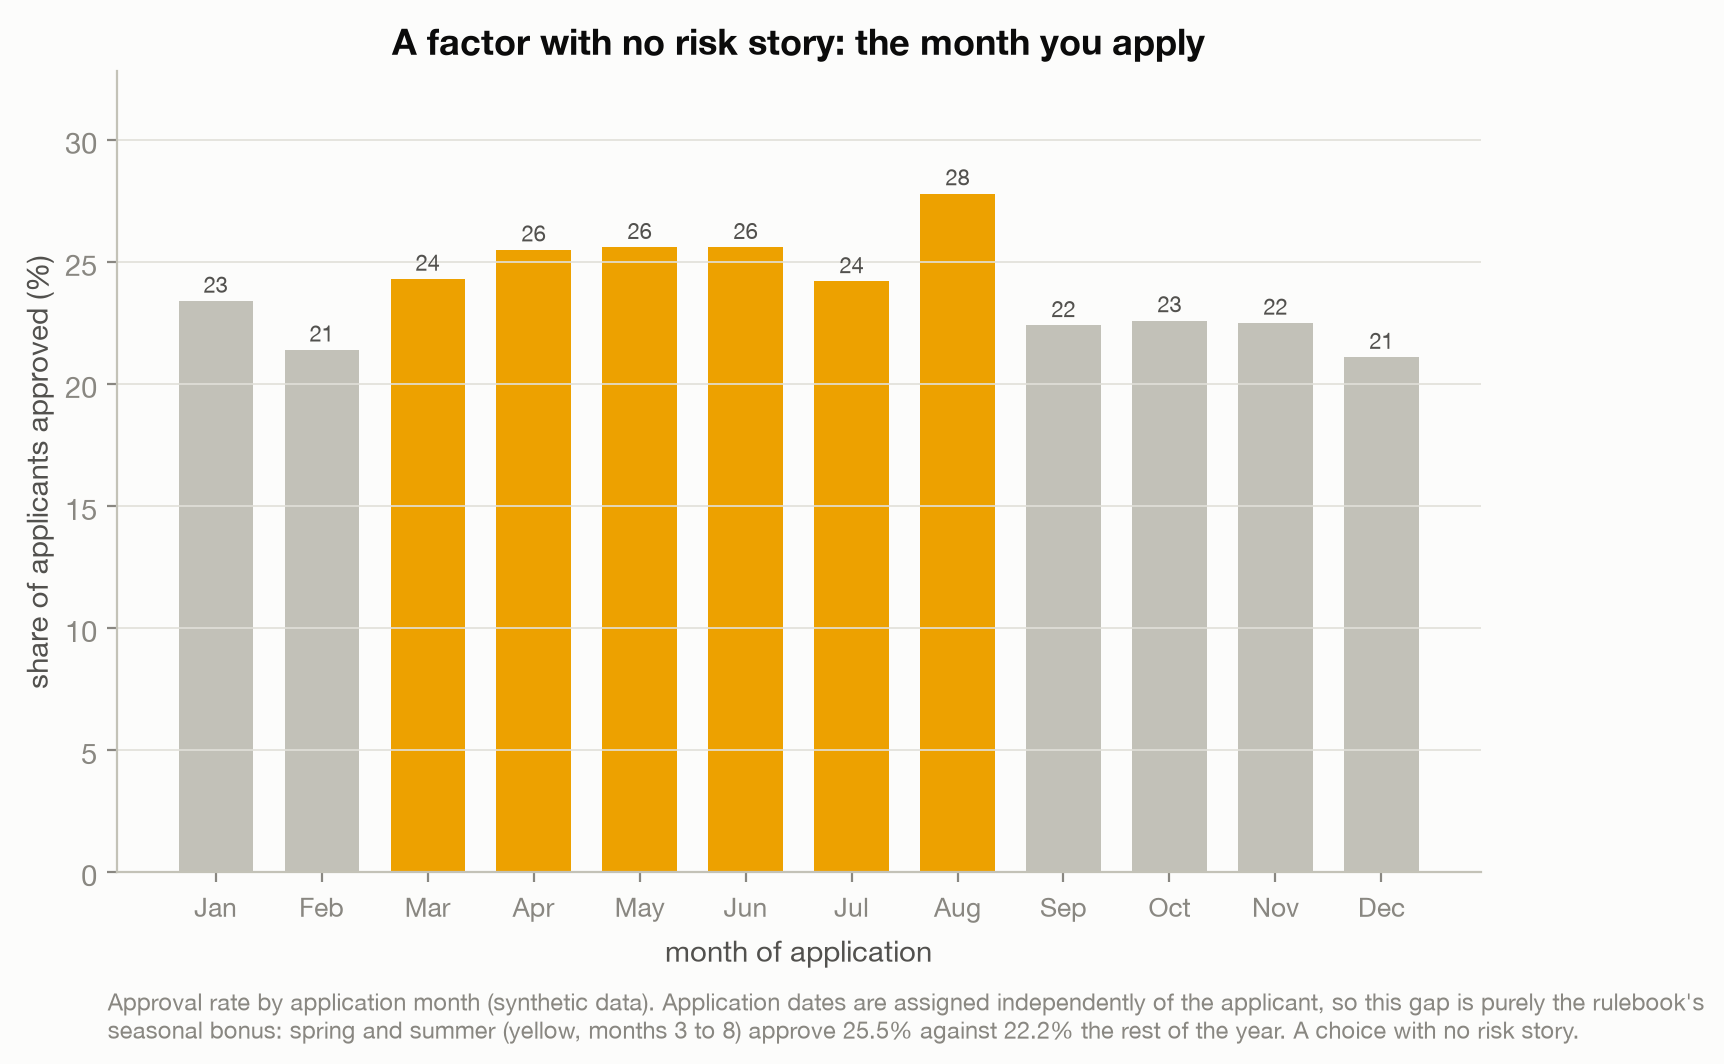
Apply in spring or summer and you are approved about 25.5 percent of the time; apply the rest of the year and it slips to about 22.2 percent. The application date is assigned independently of the applicant, so this gap cannot be hiding some feature of the people who happen to apply in August. It is a plain line in the formula: spring and summer get a bonus. Your odds move with the season, and the season knows nothing about you.
Age and education look like they belong here too, but they are more tangled, in different ways. Approval climbs with age, from about twelve percent under twenty-five to about thirty-two percent past sixty-five, and it climbs with schooling, from about fourteen percent for high school to forty-four percent for a doctorate. The age climb turns out not to be a preference at all: older applicants have more experience and higher income, which the rulebook rewards, while its one direct age term actually favors the middle-aged and works against the old. Education is a genuine split. The rulebook does hand higher degrees a direct bonus, but roughly half of the doctorate-versus-high-school gap is just that more schooling brings more income, which is the thing the rule really wants. So of the three, only the calendar is a pure choice with no risk story, the one that cannot be explained away at all.
I want to be careful here, because this is exactly the point where a synthetic toy could be mistaken for an accusation. It is not one. The rulebook does carry a direct age term of its own, and in real lending that alone would matter: the Equal Credit Opportunity Act prohibits creditors from discriminating on the basis of age, as long as the applicant is old enough to enter into a contract (Consumer Financial Protection Bureau, n.d.-b). Real lenders are not free to bake in the factors this toy bakes in. None of this is a photograph of how any bank behaves. It is a demonstration of what a scoring rule can quietly encode if nobody stops it, and a reminder that some of those choices, like the season, no law even thinks to stop.
The honest part
Everything above is true of a dataset someone designed. The relationships are there because a person put them there. That could make the whole exercise feel like a magic trick: of course income dominates, of course the season matters, someone coded it that way.
But that is the value, not the flaw. A real bank’s rulebook is a trade secret, buried in a model you will never see. This synthetic one hands you the source code, and the choices it makes are not cartoonish. They rhyme with reality. Real underwriting really does hinge on income and debt: the Consumer Financial Protection Bureau describes the debt-to-income ratio as “one way lenders measure your ability to manage the monthly payments to repay the money you plan to borrow” (Consumer Financial Protection Bureau, n.d.-a). The lesson that survives leaving the toy behind is not a specific number. It is the shape of the thing: an automated decision that looks like objective math is a stack of human choices about what counts, and most of those choices are made where you cannot see them.
Who the rulebook cannot see
There is one last thing the scorecard cannot do, and it is the quietest and the largest.
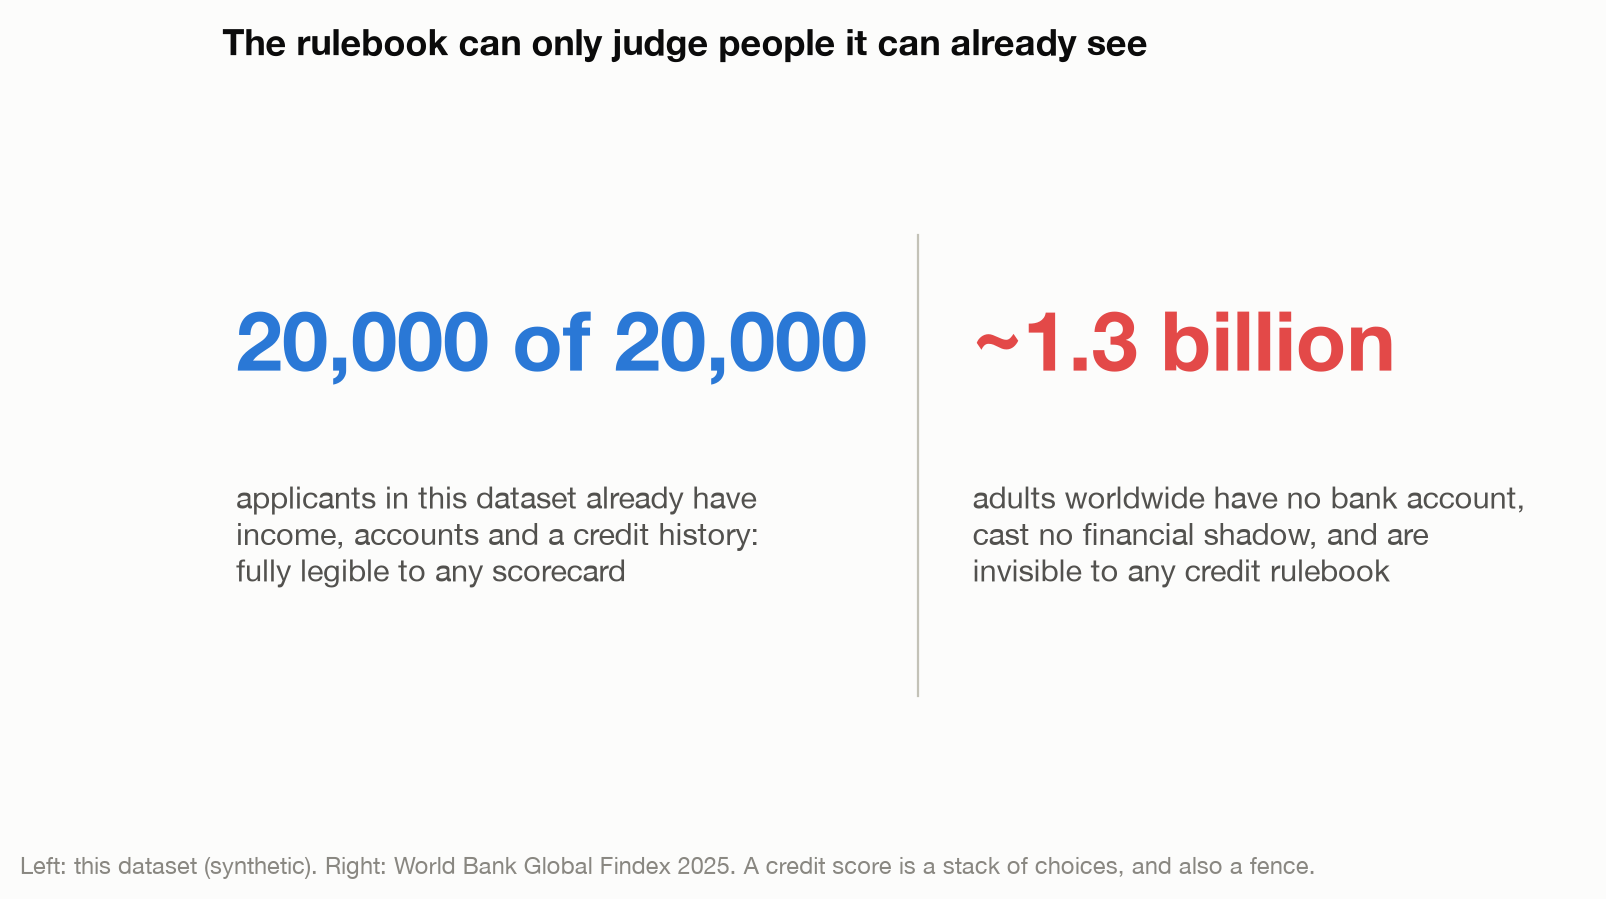
Every single one of these twenty thousand applicants already has an income, a bank account, a credit history. They are fully legible: the scorecard can see them, weigh them, price them. That is the entry ticket, and everyone in the dataset has already bought it. About 1.3 billion adults worldwide have not. They have no account at all (World Bank, 2025), cast no financial shadow, and are invisible to any rulebook like this one. You cannot be approved or denied by a system that cannot see you exist. A credit score is a stack of choices, and it is also a fence: to be judged by it, you first have to be legible to it, and more than a billion people are not.
What you are keeping score of
This was never really about a synthetic bank. It is about the number you carry around.
You are being scored right now, by rulebooks you cannot read, built from choices someone else made about what counts. The worry is not that a credit score exists. It is that we treat it as a verdict on our worth when, at least in the one rulebook we can actually open, it is mostly a price tag, outweighed by income and debt, sitting alongside factors that have nothing to do with whether you pay people back. And the people it should trouble us about most are not the ones with a low score. They are the ones with no score at all, standing outside a fence they were never given a gate to. Before you lose another night over three digits, it is worth asking what the number is really measuring, and who never gets measured at all. This is an analysis of a toy dataset, not financial advice.
Method notes
Data: Financial Risk for Loan Approval (Zoppelletto, 2024), a synthetic dataset of 20,000 applicants on Kaggle, CC0, that ships its own generator script (CSV_Generation.py). Every “rule” described is read from that generator and confirmed in the data; nothing here is a claim about any real lender. The approval rate in the data is 23.9 percent. Correlations with approval, all Pearson across the 20,000 rows: annual income 0.60, debt-to-income minus 0.41, loan interest rate minus 0.30, loan amount minus 0.24, net worth 0.19, credit score 0.14, age 0.14. Permutation importance from a gradient-boosting classifier (in-sample; the aim is which fields the model leans on, not out-of-sample accuracy) ranks debt-to-income, interest rate and monthly income highest and credit score sixth. Credit score to interest rate correlation is minus 0.60. Approval by age rises from 11.6 percent (under 25) to 32.3 percent (65 plus); by education from 14.4 percent (high school) to 44.0 percent (doctorate); spring and summer applications are approved at 25.5 percent against 22.2 percent the rest of the year. The age gradient is confounding: in the generator income and experience rise with age and are what the rule rewards, while the one direct age term (a V-shape favoring the middle-aged) works against the observed rise. The education gradient is a mix: the rule gives higher degrees a direct bonus, and higher degrees also bring more income (roughly half the gap each). The application-month effect is not confounded (dates are assigned independently of the applicant), which is why it is used as the clean non-risk factor. All figures are descriptive and associational: correlations and generator rules, not causes, and not evidence about how any real bank behaves. The real-world anchors (debt-to-income in underwriting, the ECOA age protection, the unbanked count) are external and cited below. Code is on GitHub: github.com/joechrisnaldy/data-stories.
References
Consumer Financial Protection Bureau. (n.d.-a). What is a debt-to-income ratio? Retrieved July 14, 2026, from https://www.consumerfinance.gov/ask-cfpb/what-is-a-debt-to-income-ratio-en-1791/
Consumer Financial Protection Bureau. (n.d.-b). What you need to know about the Equal Credit Opportunity Act and how it can help you: Why it was passed and what it is. Retrieved July 14, 2026, from https://www.consumerfinance.gov/about-us/blog/what-you-need-know-about-equal-credit-opportunity-act-and-how-it-can-help-you-why-it-was-passed-and-what-it/
World Bank. (2025, July 16). Mobile-phone technology powers saving surge in developing economies [Press release]. https://www.worldbank.org/en/news/press-release/2025/07/16/mobile-phone-technology-powers-saving-surge-in-developing-economies
Zoppelletto, L. (2024). Financial risk for loan approval [Data set]. Kaggle. https://www.kaggle.com/datasets/lorenzozoppelletto/financial-risk-for-loan-approval
// About the author
Jonathan Chrisnaldy is a product manager and analyst in New York City, with an M.S. in Technology Management from Columbia University. He writes data stories about the numbers behind everyday claims. More on the experience page or LinkedIn.