· 14 min read · Jonathan Chrisnaldy
The Job Nobody Takes Away
I thought becoming a manager meant trading execution for people, and that the manager still executing had failed to make the switch. Across 20 first-line supervisor occupations, managing people rises in 20 of 20 while doing the work does not fall. The promotion adds a job. Nobody takes the first one away.
Everyone can be a manager. Not everyone can manage. I believed that before I had any evidence for it, and I went looking for the evidence because I am going to be handed the job eventually and I would like to not be bad at it.
What I found says I had the diagnosis backwards.
The promotion adds a job. It does not replace one.
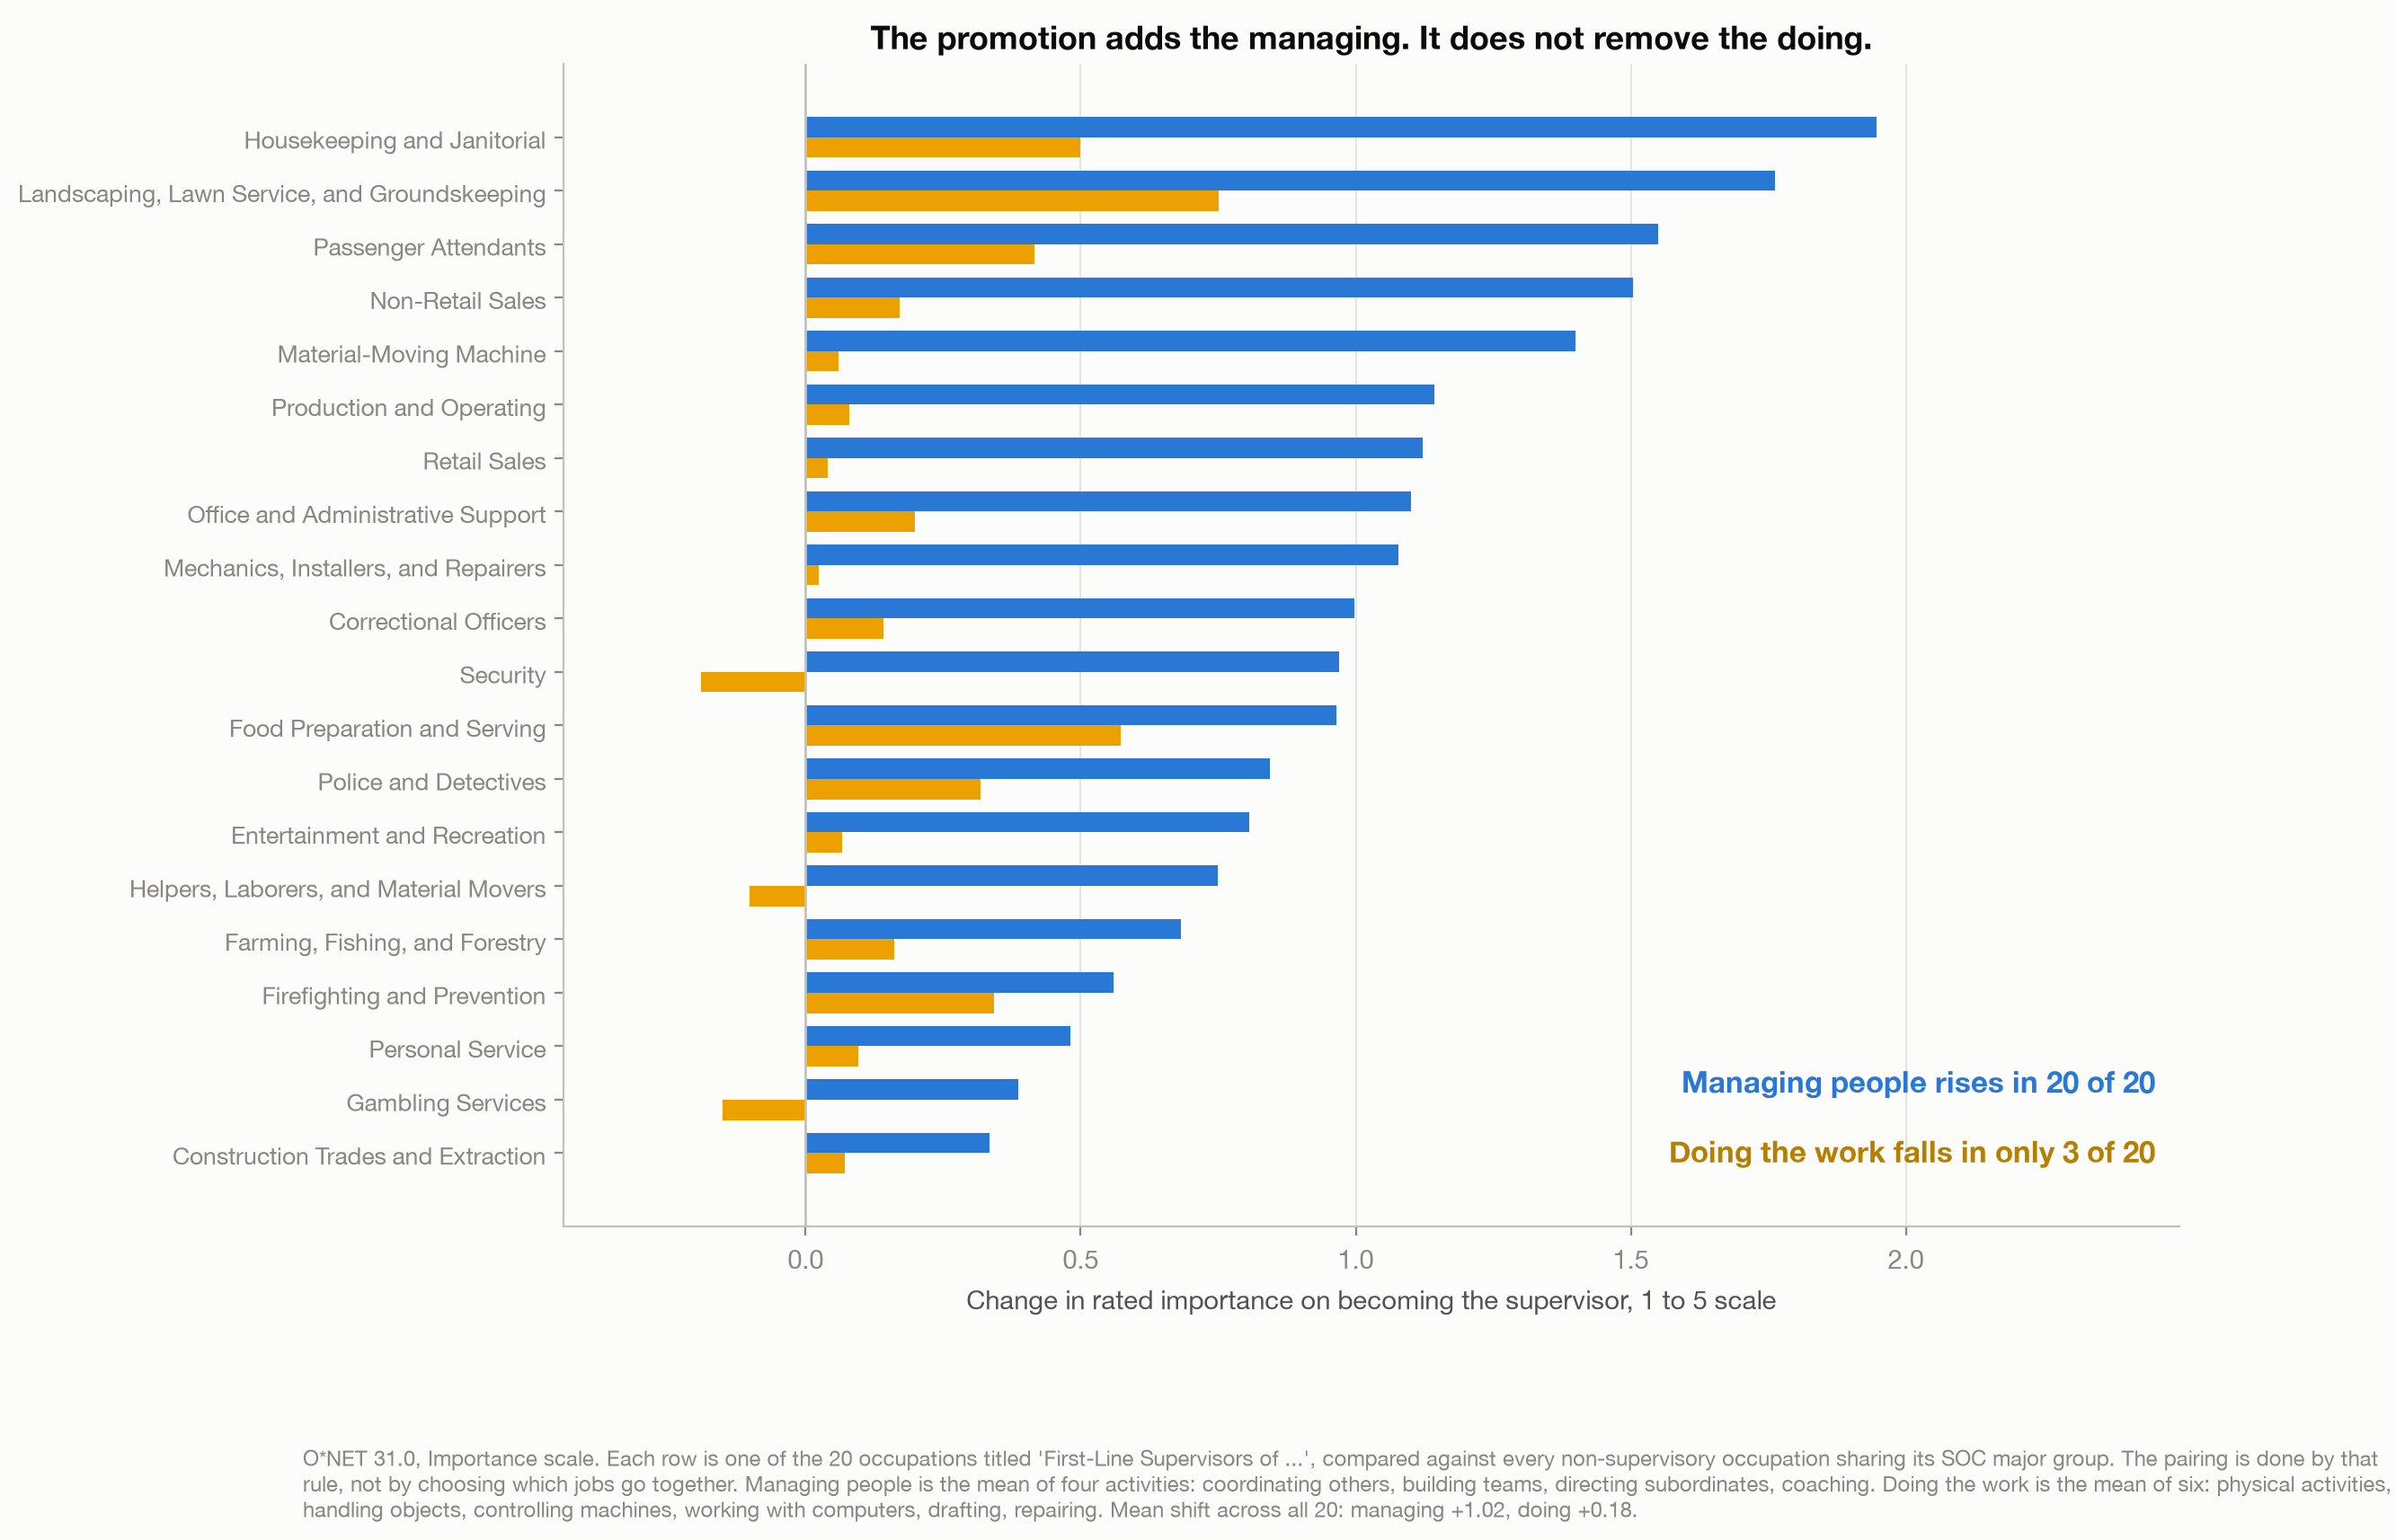
My assumption was a trade: you climb, you manage more, you execute less, and the manager who is still executing has failed to make the switch. The first half is right. The second half is not.
O*NET is the United States occupational database, and it rates how important each of 41 work activities is to each of 911 occupations. Twenty of those occupations are titled “First-Line Supervisors of” something, each named for the workers it supervises. That gives a comparison with no judgement of mine in it: every supervisor against every non-supervisory occupation sharing its occupational group.
Managing people rises in 20 of 20 comparisons, by 1.02 points on a five-point scale. Doing the work rises too, by 0.18, and falls in only 3 of 20.
A first-line supervisor of housekeeping staff scores 1.95 points higher on managing people than the cleaners, and 0.50 points higher on doing the work. The supervisor of construction trades, at the other end, is only 0.33 above the trades on managing, and still 0.07 above them on doing.
Nobody took the first job away.
What “the doing stays flat” is hiding
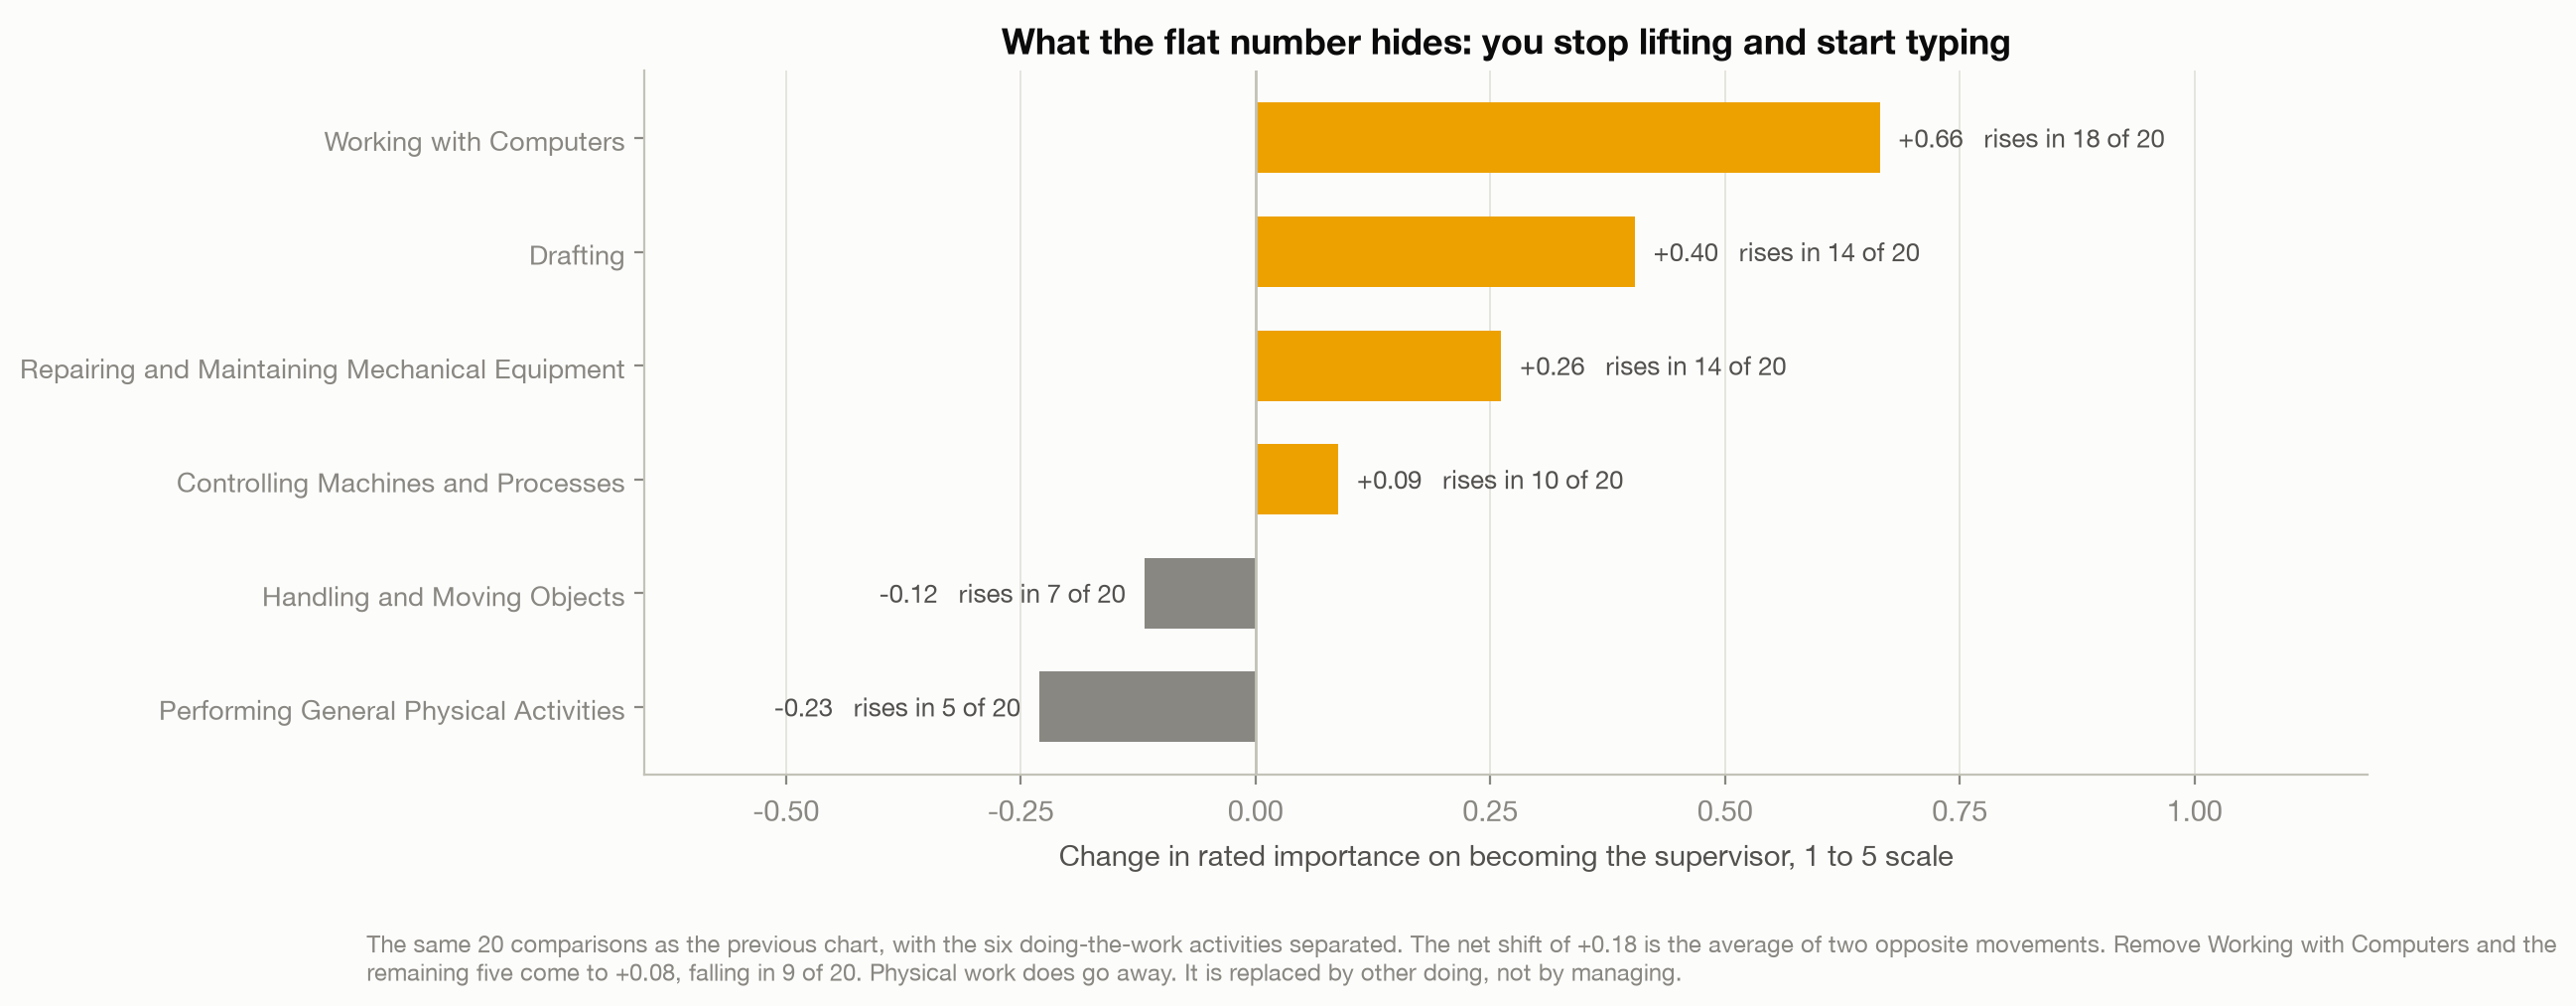
That +0.18 is an average of two opposite movements, and reporting only the average would be the kind of arithmetic this blog exists to complain about.
Physical work does fall. Performing general physical activities drops 0.23 and rises in only 5 of 20; handling and moving objects drops 0.12. But working with computers climbs 0.66 and rises in 18 of 20, drafting and specifying technical work climbs 0.40, repairing equipment climbs 0.26. Take computers out and the remaining five come to +0.08, which is nothing.
So the trade is real but it is not the trade I assumed. You stop lifting and you start typing. What leaves is the physical part of the doing. The doing itself stays exactly where it was, and a second job lands on top of it.
That reframes the manager I was complaining about. The one who is still executing has not failed to make a switch that was never offered. They were given an additional job and no instructions about which half to drop.
Seniority is not mainly about managing people
Here is where my own tidy version breaks too.
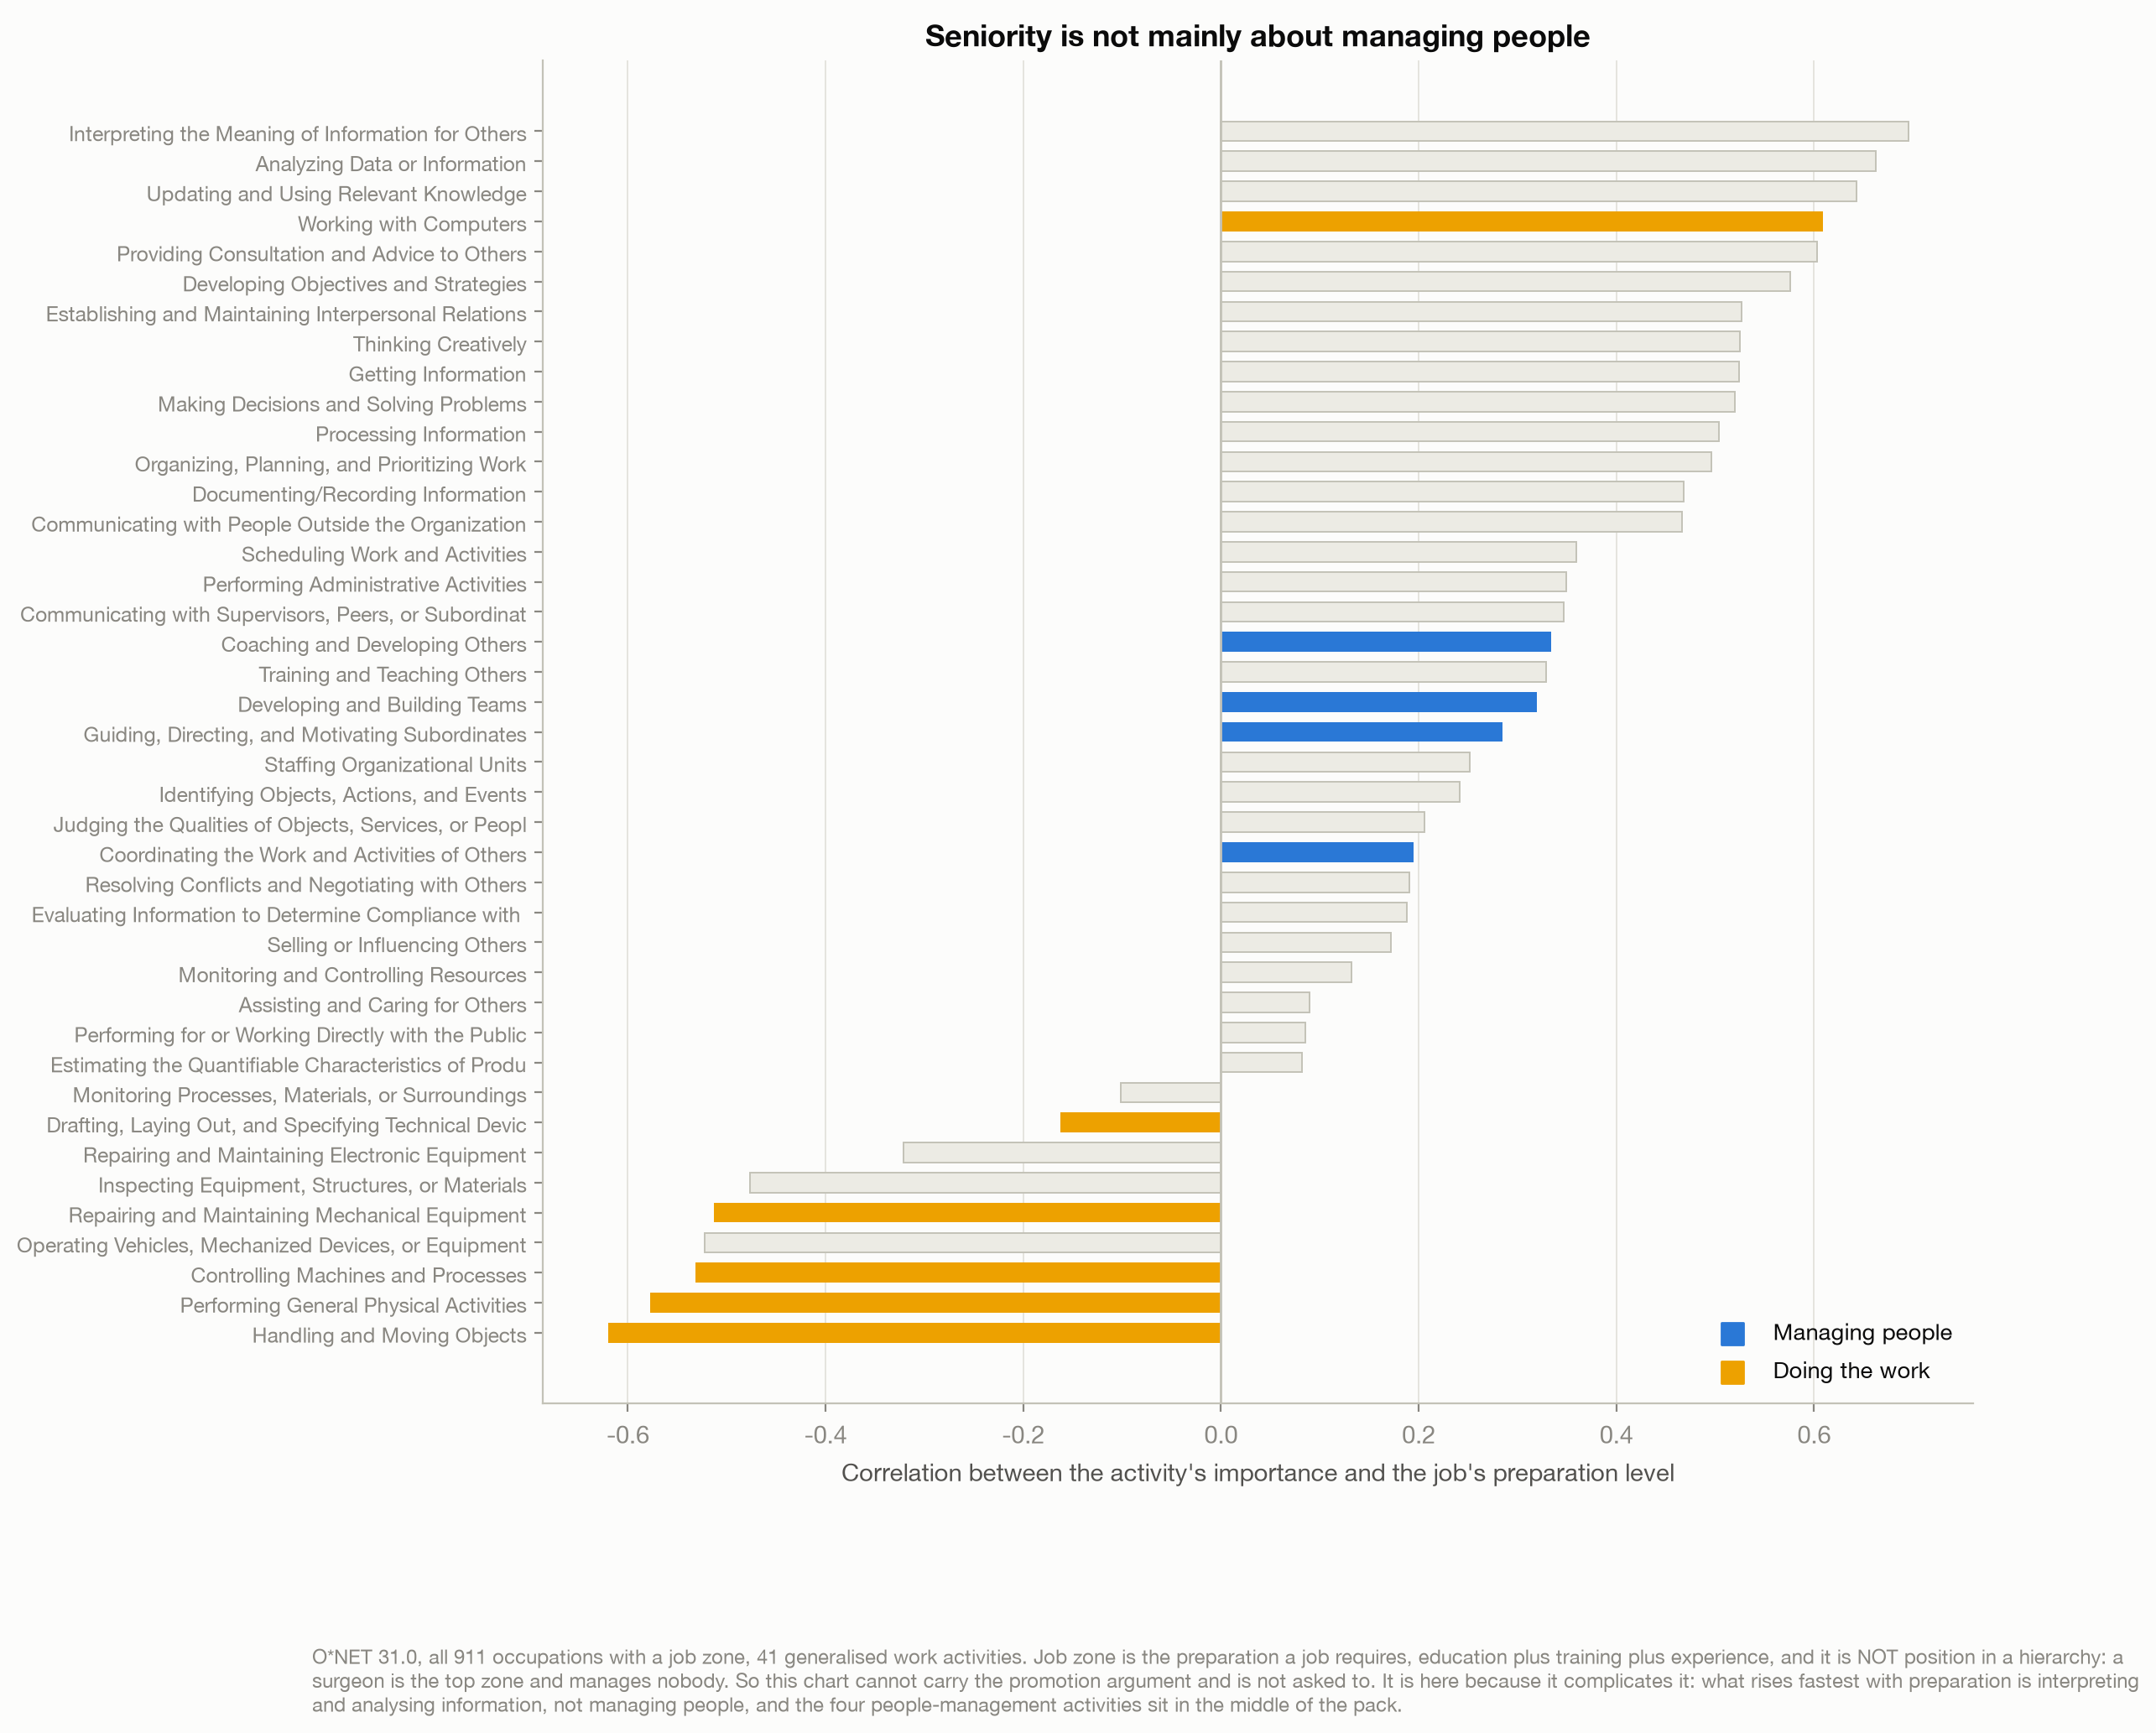
Across all 911 occupations, sorted by how much preparation the job requires, the activities that rise fastest are not managerial. Interpreting the meaning of information for others correlates 0.70 with preparation level. Analysing data correlates 0.66. Updating and using relevant knowledge, 0.64.
The four people-management activities sit in the middle of the pack: coaching 0.33, building teams 0.32, directing subordinates 0.29, coordinating the work of others 0.19.
A caution on that chart, because it is easy to misread and I nearly did. Preparation level is education plus training plus experience. It is not position in a hierarchy. A surgeon needs the most preparation of almost anyone and manages nobody. So this cannot settle an argument about promotion, and I am not asking it to. It is here because it complicates the story: if you had told me that climbing is mostly about taking on people, this chart says climbing is mostly about taking on interpretation.
What the promotion actually hands you
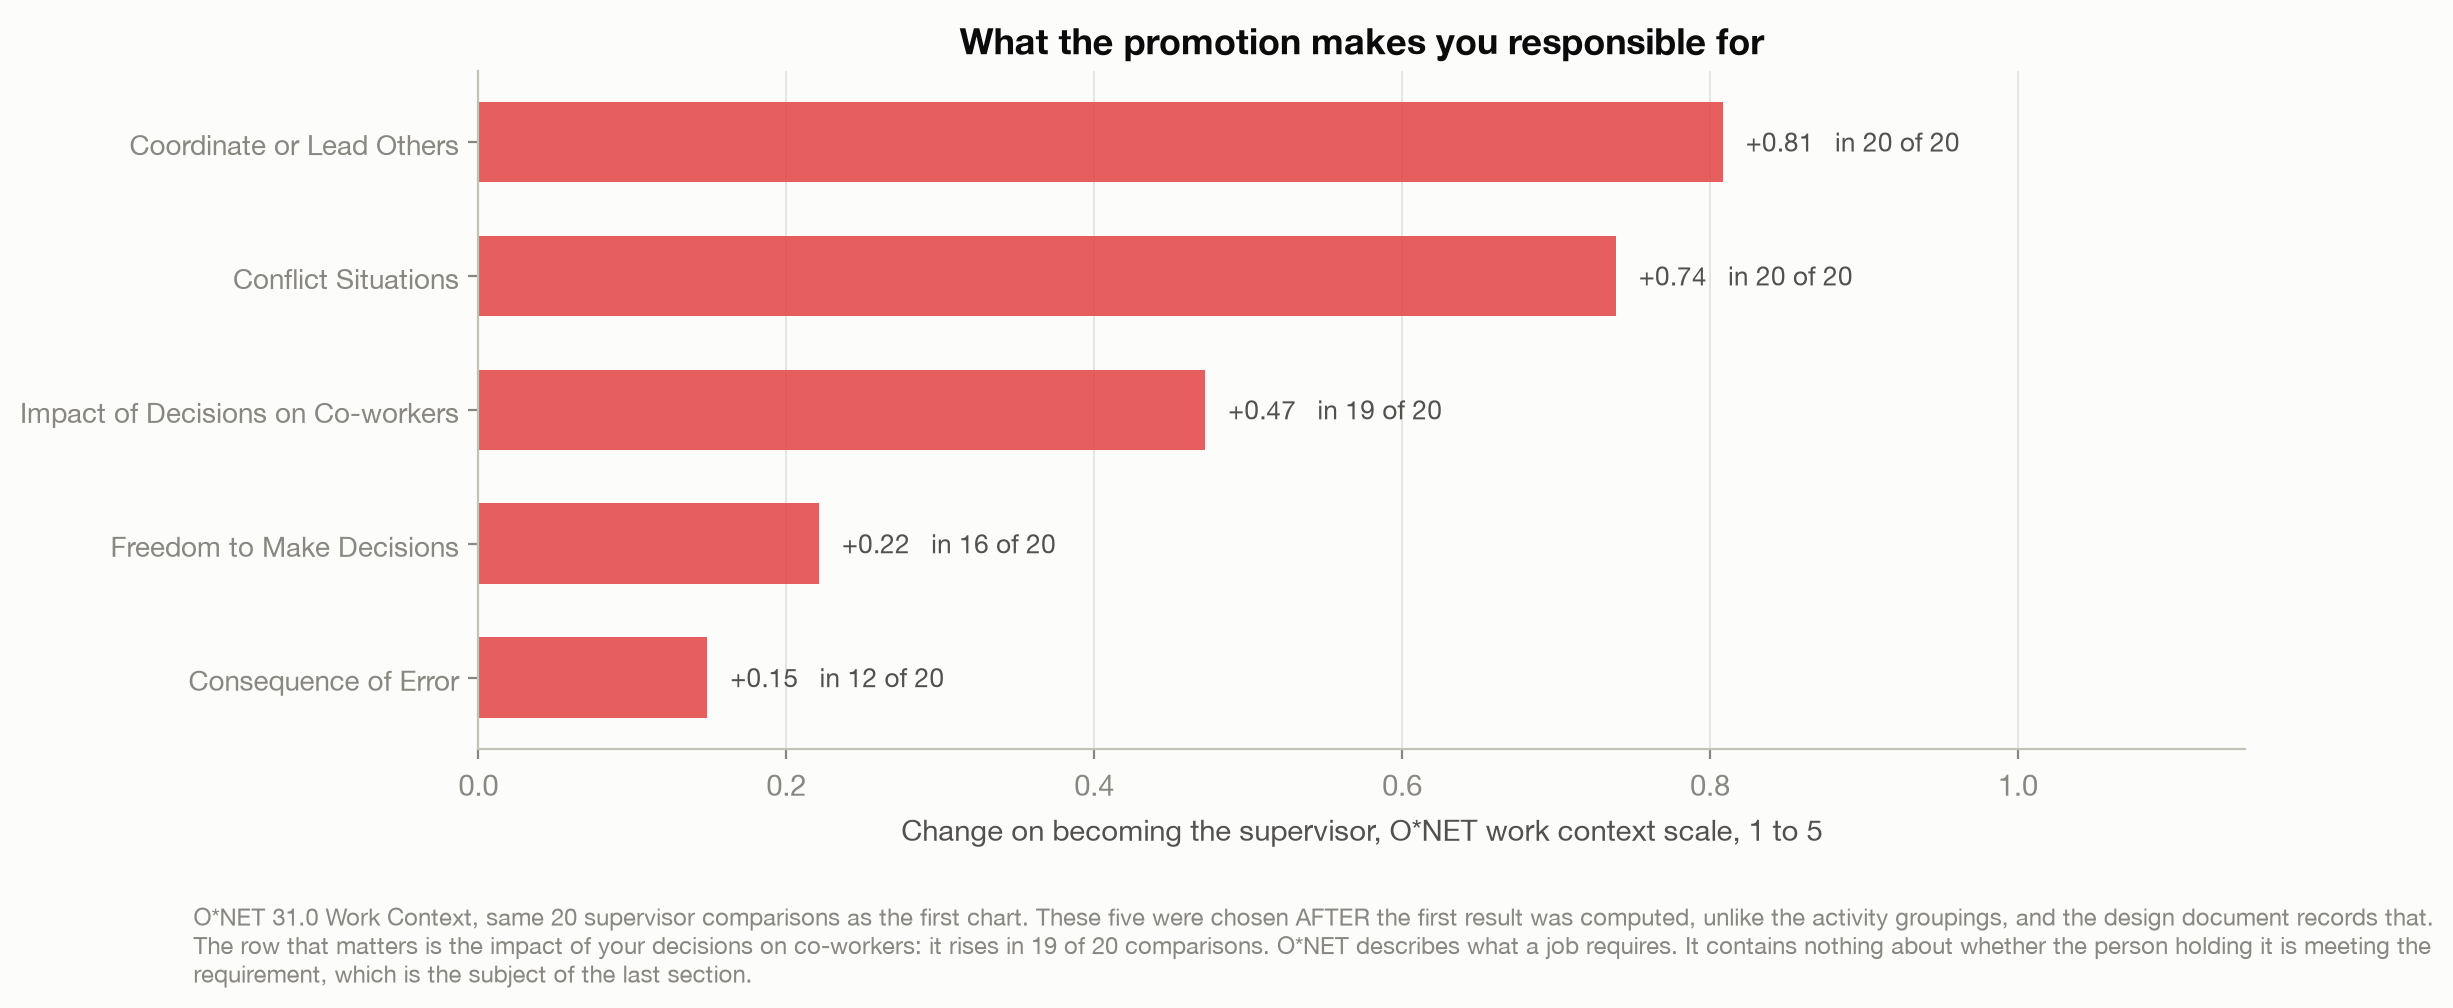
O*NET also rates the conditions a job is done under. Run the same 20 comparisons against those, and the picture sharpens.
Coordinating or leading others rises 0.81, in 20 of 20. Conflict situations rise 0.74, in 20 of 20. The impact of your decisions on co-workers rises 0.47, in 19 of 20.
That last one is the whole thing. The promotion does not mainly change what you do. It changes who pays for it when you get it wrong.
This is where my original complaint came from, and it survives in a form I did not expect. I have worked evenings that existed because of a decision taken weeks earlier by somebody who was not working that evening. I had filed that as a manager doing the wrong task. It is better described as a manager carrying a second job nobody measured, in a role where the cost of getting it wrong had quietly moved onto other people.
The part you cannot check
So: how would you know if you were the bad one?
Badly, is the answer. The World Management Survey has scored management practices at thousands of firms across multiple countries and sectors, and at the end of the interview it asks the manager a question that is not scored at all: “Excluding yourself, how well managed would you say your firm is on a scale of 1 to 10, where 1 is worst practice, 5 is average and 10 is best practice” (Bloom et al., 2014).
Those self-scores correlate with the firm’s actual labour productivity at 0.03. Nothing. The measured practices predict productivity; the manager’s opinion of the place predicts nothing. As the authors put it, many good managers underestimate their firm’s quality while many poor managers overestimate it.
Note what is being asked. Not “how good are you”, which anyone would flatter. Excluding yourself. Even the assessment of everyone else is worthless as a signal.
And the database I have spent this whole post inside has the same hole in it, from the other side. O*NET can tell a new supervisor precisely what their job demands: coordinating at this importance, coaching at that one, this much exposure to conflict. It contains nothing whatsoever about whether the person holding the job is meeting any of it. The most detailed occupational database in the world describes the role and is silent on the performance.
Two things you can check instead
If introspection does not work, the answer is not better introspection. It is to use the things that sit outside your head.
Your team’s hours. Overtime is not a fact about how hard your team works. It is usually a fact about when a decision got made, and by whom. The chart above says the cost of your decisions lands on co-workers more after the promotion than before it. Their evenings are that cost, rendered in a unit you cannot argue with.
Your own calendar. Not how full it is, which measures nothing but demand. Which of the two jobs it went to. The data says you now hold both, and only one of them has a visible output. Shipped work announces itself. A bottleneck cleared three weeks before it would have formed announces nothing at all, and that asymmetry is exactly why the invisible half is the half that slides.
What this does and does not show
It does not show that managers who execute are bad managers. The finding is that the job is additive, not that the doing is wrong, and a supervisor who never touches the work is a different failure with its own name.
It does not measure hours. O*NET rates how important an activity is to a job, not how long anyone spends on it. I started out thinking in terms of time, and the honest version of this argument is about what a job requires rather than how a day divides.
And the twenty comparisons are supervisors of cooks, cleaners, cashiers, mechanics, police officers and construction crews. There is no “First-Line Supervisors of Software Developers” in the American occupational classification, so the reader I had in mind is not in the data. I think it transfers, and here is the argument rather than the assumption: what rises across all twenty is coordinating, directing, team-building and coaching, and none of those four is specific to a trade. What falls is lifting things, which was never the engineering part anyway.
What survives is this. Everyone can be a manager, and I still think not everyone can manage, but the reason is not the one I started with. It is not that the job swaps execution for people and some people fail to swap. It is that the job adds people to execution, hands you the cost of other people’s evenings, and then gives you no instrument to check yourself with. The people who manage are the ones who go and find an instrument anyway.
I have not been a manager yet. When I am, I expect to make exactly this mistake, and the only thing I have going for me is knowing in advance which half slides.
Method notes
What is being counted. ONET 31.0, the United States occupational database maintained by the National Center for ONET Development, released under a Creative Commons Attribution licence and downloadable without registration (National Center for O*NET Development, 2026). It rates 911 occupations on 41 generalised work activities using an Importance scale of 1 to 5, and on a set of work-context measures using a separate 1 to 5 scale. It measures how important an activity is to a job. It does not measure hours, and nothing in this post should be read as a claim about time. That is a real limit on the argument I set out to make, which was about time, and it is why the sentences here are about what a job requires.
The comparison. Twenty O*NET occupations are titled “First-Line Supervisors of” something. Each is compared against every non-supervisory occupation sharing its occupational group, which is the group the supervisor’s own title names. No pair was chosen by hand. The comparison groups range from 6 occupations (housekeeping, landscaping) to 106 (production and operating), and the per-comparison figures are in the repository rather than only the averages.
The two activity groups, and what was left out. Managing people is the mean importance of four activities: coordinating the work and activities of others, developing and building teams, guiding and directing and motivating subordinates, and coaching and developing others. Doing the work is the mean of six: general physical activities, handling and moving objects, controlling machines and processes, working with computers, drafting and specifying technical devices, and repairing and maintaining mechanical equipment. Two activities were deliberately excluded from the managing group: training and teaching others, because teachers score high on it without supervising anyone, and providing consultation and advice, because consultants and doctors advise without having subordinates. Both exclusions raise the bar for what counts as managing.
The groupings are not blind, and that limits them. They were written down and committed before the supervisor comparison was run, but after I had already applied the same groupings to a different question. They are theory-driven and any reader can check them activity by activity against the published definitions, but I had seen a related result first.
Charts one and two were specified in advance. Charts three and four were not. The design document fixed the first two before the data was touched and left the last two open, because I did not know what the evidence would support for the final section. They were chosen after the first result was computed. A chart selected after seeing the data is a weaker object than one selected before, and the reader is entitled to know which is which.
Three falsification conditions, none of which fired. Written before the comparison was run. One: managing people does not rise from worker to supervisor. Two: doing the work falls by at least as much as managing rises, which was my original thesis and a live possibility. Three: the pattern reverses in the skilled and technical groups, meaning it is an artefact of low-skill service work. All three are scored explicitly in the repository.
Preparation level is not hierarchy. The third chart uses O*NET’s job zone, which combines education, training and experience. It is not a rank in an organisation. A surgeon sits in the highest zone and manages nobody. That chart is offered as a complication, never as evidence about promotion.
Why the self-assessment finding is quoted rather than reproduced. The World Management Survey publishes its data behind a registration wall this analysis did not pass, so the 0.03 correlation is cited from the paper that reports it rather than recomputed here. Every other number in this post comes from a script in the repository.
On the experience in this piece. Anything I describe from having been managed is a composite drawn across different jobs and years. It describes no single workplace, no single team and no particular week, and it is here as evidence about the manager I expect to become rather than as an account of anyone who has managed me.
References
Bloom, N., Lemos, R., Sadun, R., Scur, D., & Van Reenen, J. (2014). The new empirical economics of management (NBER Working Paper No. 20102). National Bureau of Economic Research. https://www.nber.org/papers/w20102
National Center for ONET Development. (2026). ONET 31.0 database [Data set]. U.S. Department of Labor, Employment and Training Administration. Retrieved September 7, 2026, from https://www.onetcenter.org/database.html
// About the author
Jonathan Chrisnaldy is a product manager and analyst in New York City, with an M.S. in Technology Management from Columbia University. He writes data stories about the numbers behind everyday claims. More on the experience page or LinkedIn.