A one-project-at-a-time case-study viewer. Each entry walks through the problem, what I
did, and the outcome - page between them with the arrows, keyboard, or a swipe.
// click ← → to move between projects · scroll to read
01 / 10SWIFT Message Compiler
// automation project
SWIFT Message Compiler
//Problem
Every day the Settlement team works through a folder of incoming SWIFT print files by hand, picking out the messages that matter and recapping them into a single document for review. The newer ISO 20022 (MX) messages arrive in a different layout from the familiar MT format, and routine MT940 statements clutter the pile. Doing this manually across dozens of files is slow, repetitive, and easy to get wrong.
//What I did
→Built a script that scans every SWIFT print file in a folder and sorts each one automatically into keep, convert, or skip.
→Filtered out routine MT940 statements automatically, while preserving the specific exceptions that still need to be reviewed.
→Converted ISO 20022 (MX) messages into the familiar MT layout (MT103, MT202, MT202 COV, and others), mapping references, parties, amounts, value dates, and charge details.
→Compiled every selected message into one formatted Word document, each on its own page with a summary header, generated without needing Microsoft Word installed.
//Outcome
→Cut the daily recap from about 65 minutes to roughly 15 seconds, around 260 times faster, every day.
→Merged 27 messages from 28 files in one run, including 18 ISO 20022 conversions.
→Standardized MX and MT messages into one consistent, readable layout for faster review.
→Runs on any Windows machine with nothing to install, building the Word file directly.
PowerShell Automation SWIFT ISO 20022 Settlement
// automation project
ALM Data Automation
//Problem
Preparing the monthly ALM (Asset Liability Management) dataset was a manual Excel marathon. Every month-end meant pulling a core banking extract plus six reference reports, then cleaning, matching, and populating hundreds of rows of interest rates, value and maturity dates, and other fields entirely by hand. It took around four hours, invited copy and lookup errors, and had to be repeated every single month.
//What I did
→Mapped the full month-end workflow, from raw extracts to the final file, to capture every transformation and edge case.
→Built one Python script that ingests the core banking extract, six reference reports, and the prior month's output, then runs all cleaning, lookups, and balancing automatically.
→Encoded the existing business rules for rates, dates, and classifications, and wrote a full processing log to preserve an audit trail.
→Packaged it to run from a single command with simple prompts, producing the finished, formatted Excel ready for review.
//Outcome
→Cut the month-end run from about 4 hours to roughly 15 seconds, around 960 times faster.
→Removed manual copy, paste, and lookup errors, giving consistent and repeatable output every month.
→Freed up analyst time to focus on review and analysis instead of assembling data.
→Built-in logging makes every run traceable and easy to verify.
Python Automation Banking Ops Excel Data
// vendor accountability
Trello Ticket Automation to Report
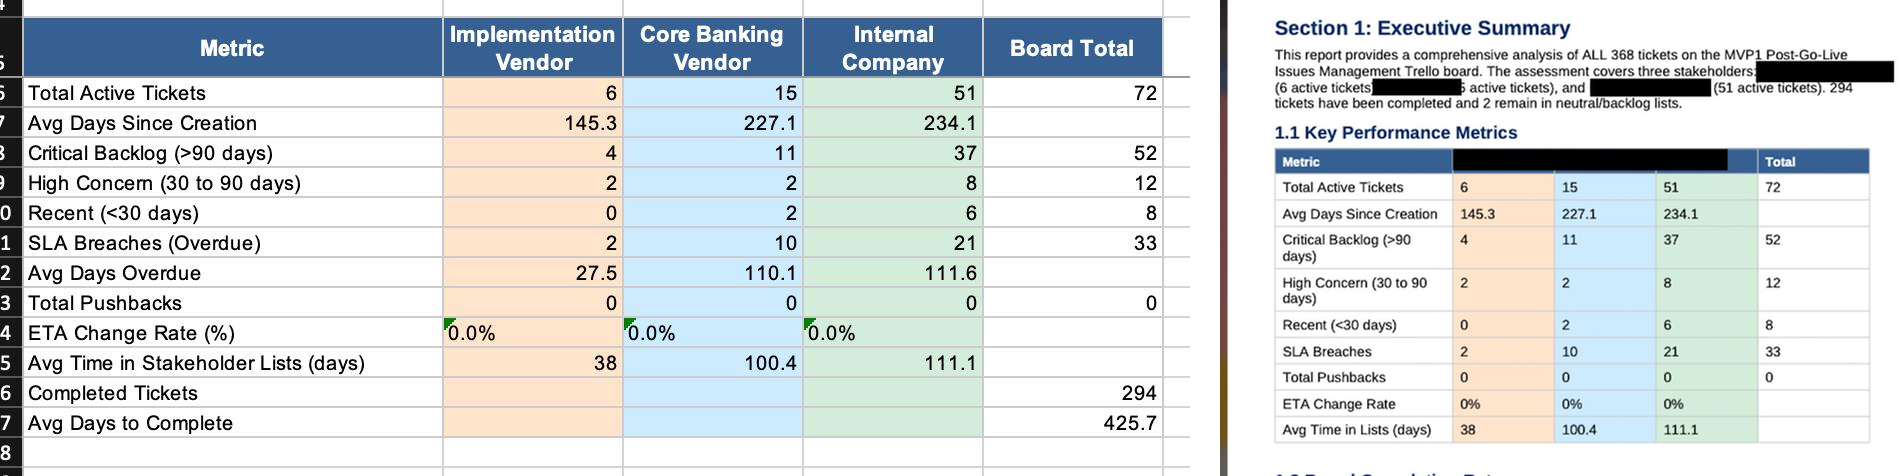
One Trello board, hundreds of issues, three stakeholders - the same numbers mirrored from a self-serve Excel workbook into a stakeholder-ready Word report, refreshed in four minutes.
//Problem
Two Trello boards (MVP1 Post-Go-Live Issues, MVP2 Projects) tracked hundreds of issues across three stakeholders (Implementation Vendor, Core Banking Vendor, and the Internal Company team). Vendors pushed deadlines repeatedly through comment threads, not through formal due-date updates, so the official Trello board looked healthier than reality. Keeping a manually maintained tracker that reflected the real state of every card took at least two hours every single day, and even then the team had no objective audit trail to prove SLA breaches, no week-over-week comparison, and no way to surface which tickets were genuinely overdue versus parked. Without that evidence, every escalation devolved into "your word against ours" and the contractual service credits stayed unclaimed.
//What I did
→Built a Python and Node pipeline against the Trello REST API that fetches every card, list movement, comment, and due-date event for both boards on demand. Caught a silent Trello action-filter bug that was hiding all list-movement and due-date data, fixed it, and verified the corrected pipeline picked up 20+ movements per card that had previously been missed.
→Designed a triple-stakeholder time-accounting model (Implementation Vendor, Core Banking Vendor, Internal Company) that walks each ticket's full journey from creation, classifies every list segment by responsible stakeholder, and sums calendar days held per stakeholder over the ticket's entire lifetime.
→Authored the analysis layer that converts raw Trello actions into stakeholder summary metrics, critical-backlog severity, SLA-breach reports, ETA-change tracking, per-list bottleneck analysis, completion-rate analysis, and repeat-offender flags for tickets that bounce between vendors.
→Generated four weekly deliverables from a single command in roughly four minutes end to end: a multi-sheet Excel workbook with colour-coded vendor breakdowns and AutoFilter, a Word performance report with executive summary and recommendations, a User Guide explaining every sheet and column to stakeholders, and a raw JSON for downstream analysis. Replaced what had been a two-hour daily manual update cycle.
→Added a label-exclusion layer for the MVP2 board so tickets carrying MVP1 Backlog, Progress Tracking, or Moved to MVP2 Plan labels are removed from every metric but reproduced verbatim in a dedicated "Excluded Tickets" sheet for transparency.
→Built a Priority Adjustment tab listing every ticket in the active triage lists so I can set P1-P3 in one view during the daily standup instead of scanning four separate stakeholder sheets.
→Built a per-ticket detailed audit-trail workbook for escalation cases - full comment history, full list-movement history with timestamps and actor, per-stakeholder time breakdown, segment-level dwell, and overdue calculation. Used this exact output to back the formal escalation emails to vendor leadership.
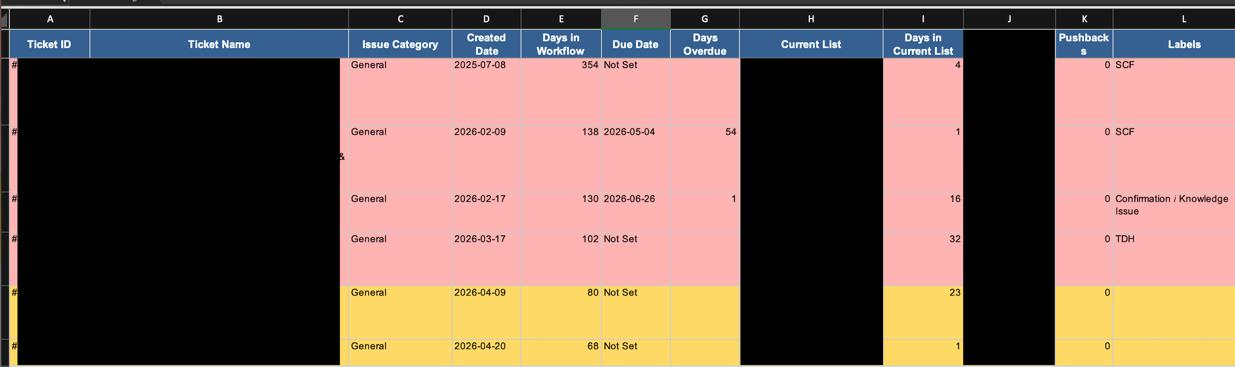
Underneath every summary number sits ticket-level evidence: red rows flag critical backlog over 90 days in workflow, yellow rows the high-concern range. Severity, due dates, and days overdue are computed straight from the API, not retyped - the layer that ended the "your word against ours" debate with vendors.
//Outcome
→Captured USD 150K in annual vendor service credits. The objective audit trail made it impossible for vendors to dispute the breach pattern, so contractual penalties that had previously been written off were finally enforced.
→Compressed the daily tracking effort from at least two hours of manual screen-reading into a single four-minute automated run - roughly ten hours per week of senior-analyst time returned to higher-value work.
Retail and internal investors relied on manual equity research for Indonesian stocks. Data lived across price feeds, fundamentals, and broker reports; producing a proper memo (thesis, valuation, risks) took hours and was hard to repeat consistently across tickers.
//What I did
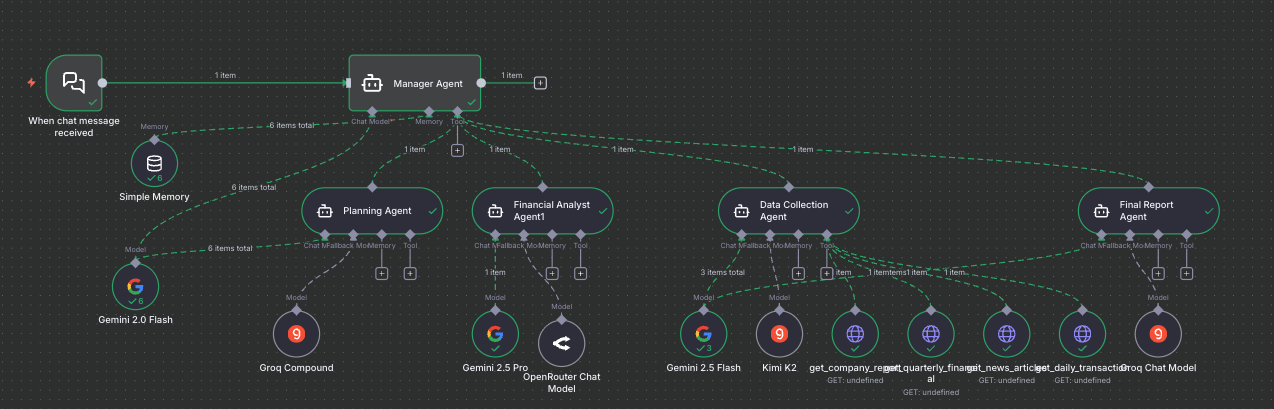
→Built an n8n workflow that pulls live fundamentals and market data from the Sectors API for any Indonesian ticker.
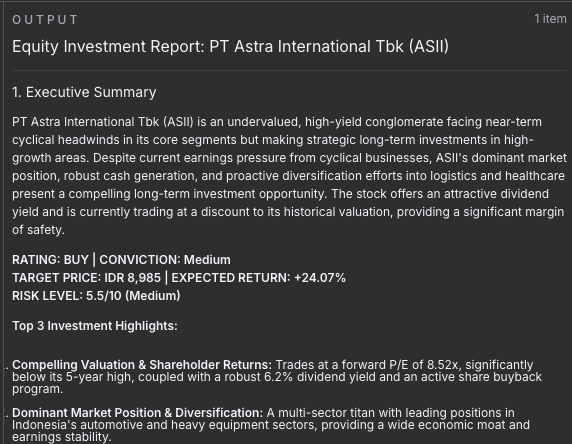
→Orchestrated an AI agent to turn raw data into a structured 6-section memo (Executive Summary, Company Overview, Financials, Valuation, Risks, Recommendation).
→Standardized prompts and fields (target price, upside %, risk score, key drivers) so every report is comparable and ready to share.
Generated 6-section equity memo - standardized and shareable.
//Outcome
→Investment-grade reports in minutes instead of manual deep dives.
→A consistent, repeatable format that scales from one stock to a whole watchlist.
→A reusable AI research building block for future investor tools.
n8n AI Agent Sectors API Prompt Eng.
// flagship project
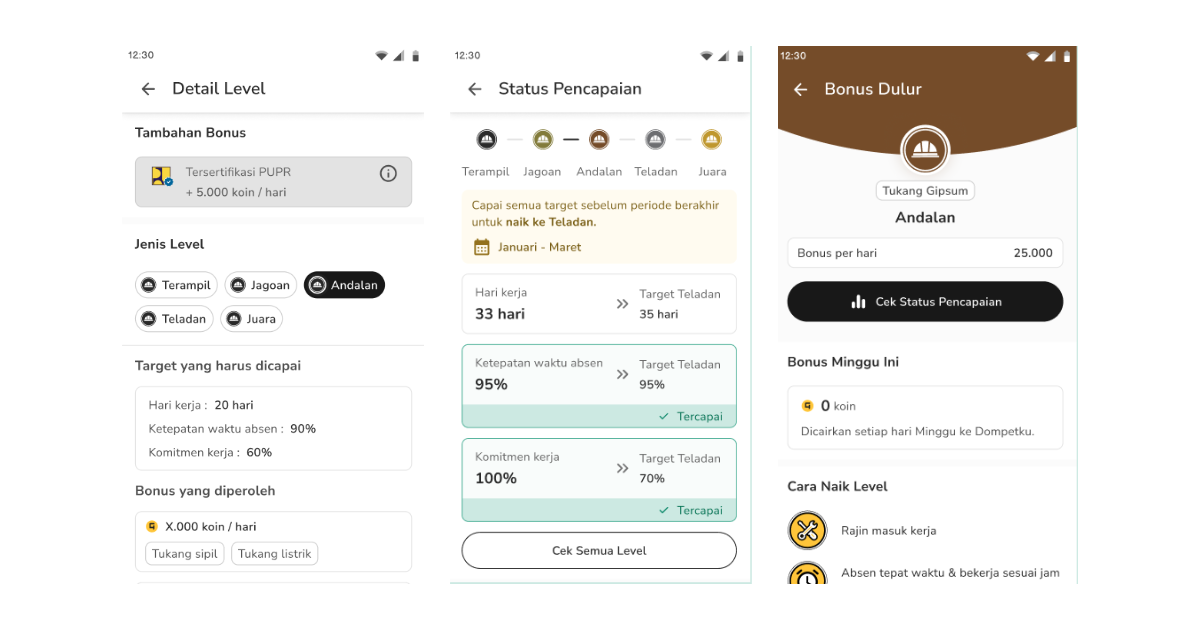
Worker Loyalty Program
//Problem
Tenure-based bonuses rewarded seniority over performance. People in the same job earned different payouts, morale slipped, and bonus spend kept climbing - unfair and financially unsustainable.
//What I did
→Audited 24 months of attendance, output, and payout data to quantify inequality and cost drivers.
→Co-designed a transparent RFM-style score (Recency of attendance, Frequency of on-time shifts, Monetary/productivity value & certifications).
→Created tiered levels with clear thresholds and daily/weekly in-app progress (status page, level details, bonus estimator).
→Piloted, simulated payout scenarios, tuned thresholds to budget, and built rollout comms/training.
//Outcome
→Replaced tenure bias with merit-based rewards workers could understand and influence.
→USD 216.2K annual savings while keeping top-performer bonuses competitive.
→Cleaner governance and stronger engagement through in-app visibility of goals.
RFM Analytics Product Mobile
Registration Flow
//Problem
Recruiters verified applications by phone - chasing missing fields, confirming test attendance, fixing errors. With up to 800 applicants/month and only six recruiters, onboarding was a bottleneck that slowed time-to-hire and caused drop-offs.
//What I did
→Mapped the end-to-end funnel to find where applications stalled.
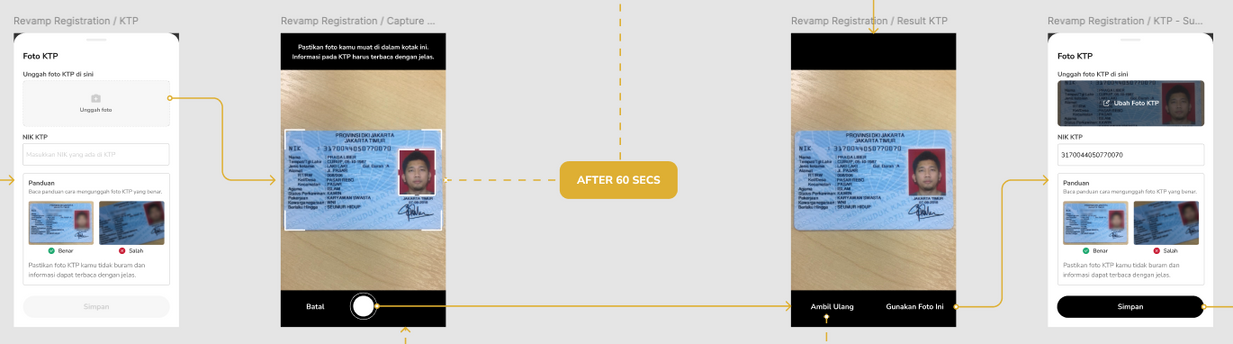
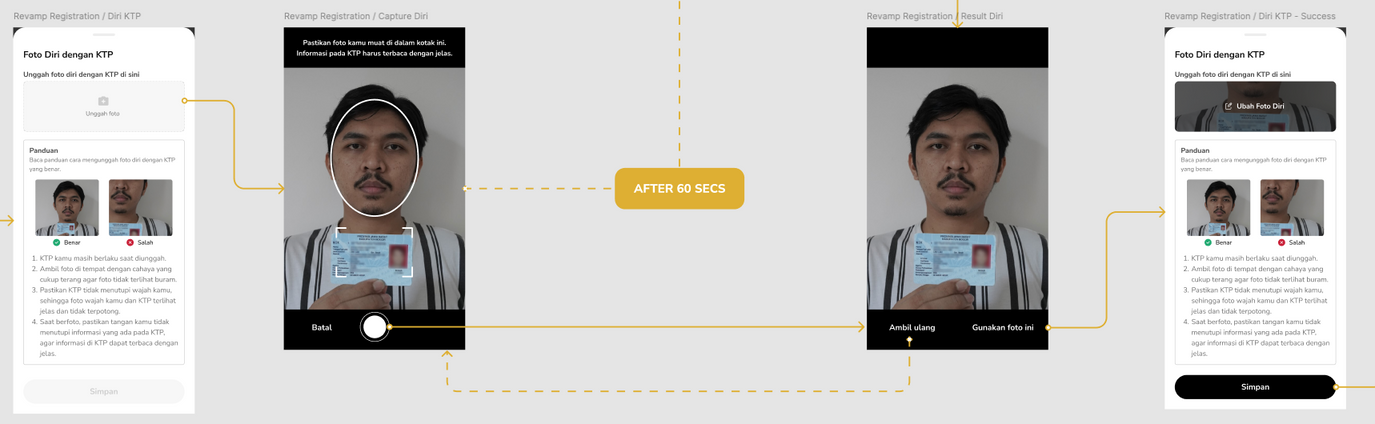
→Designed a mobile flow with guided ID capture and selfie-with-ID, clear in-app instructions, and instant field/format validation.
→Automated verification → testing → registration with status tracking, auto-notifications, and exception queues for recruiter follow-up only when needed.
→Coordinated the build with engineering and wrote rollout playbooks for ops.
Guided capture, instant validation and automated status tracking.
//Outcome
→50% faster processing, freeing recruiters to focus on exceptions.
→Fewer errors and abandoned applications.
→Onboarding scaled to peak volumes without adding headcount.
UX Mobile Automation KYC
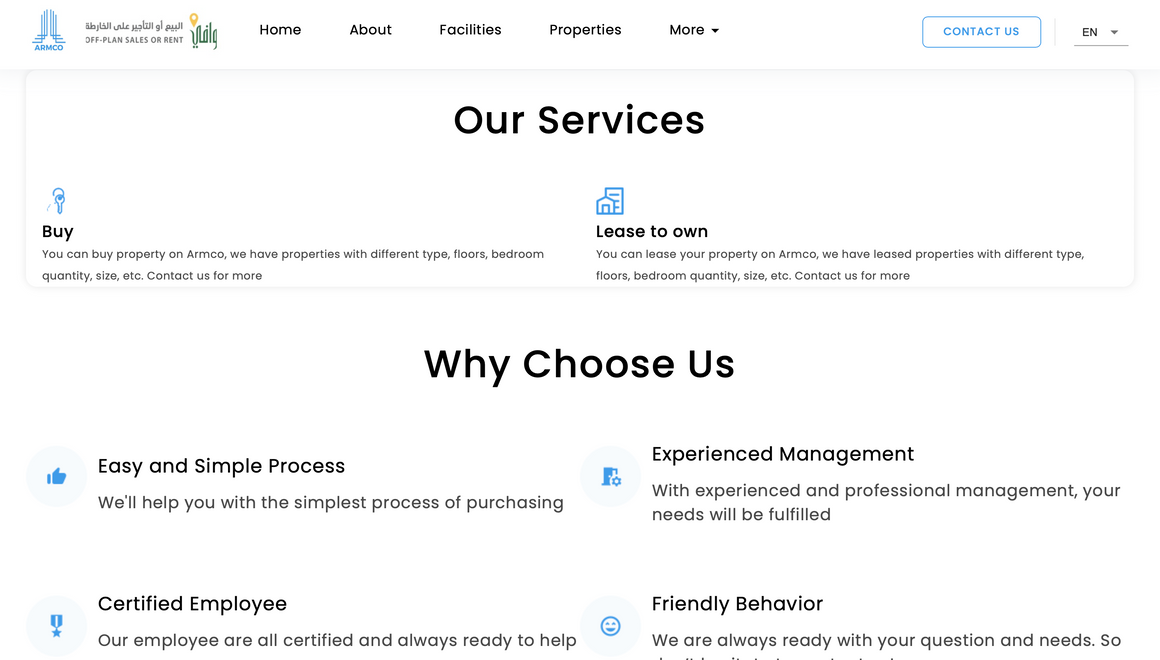
Property Listing: Armco
//Problem
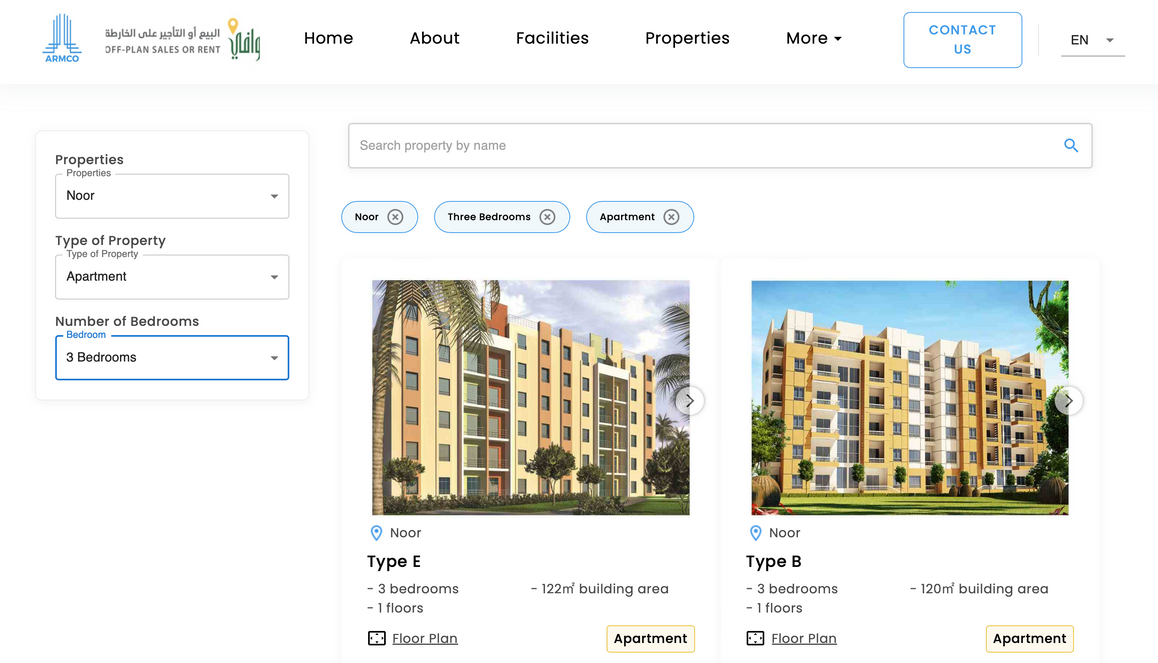
Buyers and investors couldn't quickly discover relevant units. Inventory was hard to filter, project details were scattered, and agents fielded repetitive 'do you have…?' calls, slowing inquiries and tours.
//What I did
→Led discovery with sales/marketing to define user journeys (buyer, renter).
→Designed IA and UX for fast search + faceted filters (location, property type, bedrooms, floor plan).
→Created rich project pages (amenities, floor plans, contact CTAs) with a CMS workflow for non-technical updates.
→Implemented multilingual support, responsive design, basic SEO, and analytics to track search → inquiry funnels.
Faceted search and rich, CMS-maintained project pages.
//Outcome
→A credible, user-friendly catalog that cuts time-to-find and reduces repetitive agent follow-ups.
→More qualified inquiries routed to sales.
→Content maintainable and scalable as new projects come online.
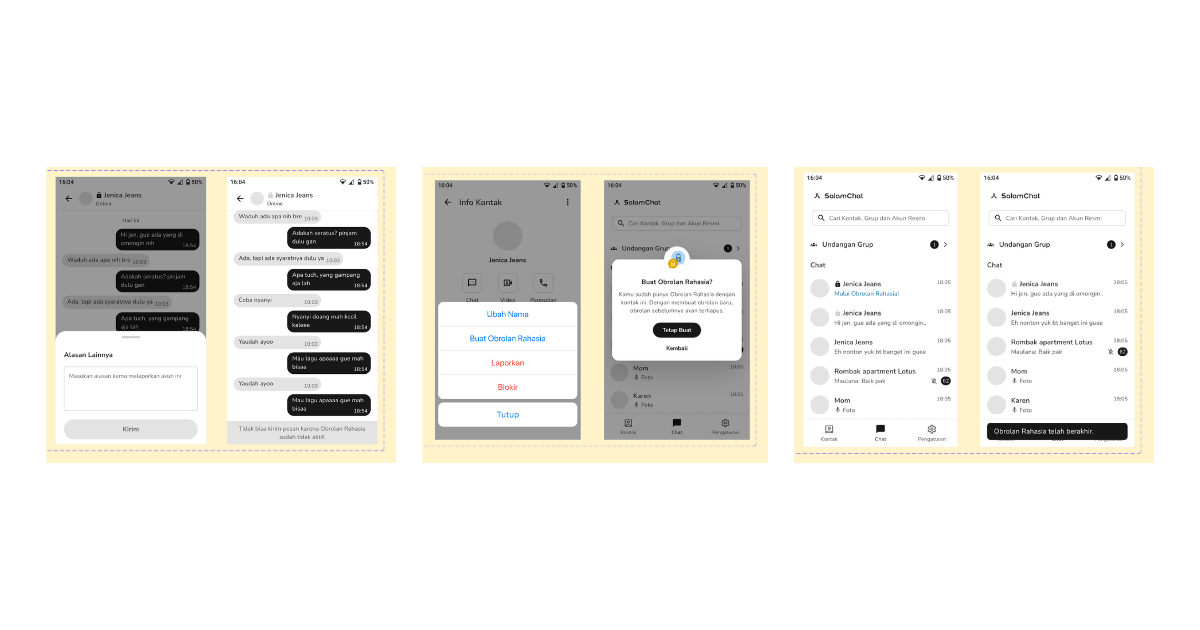
After projects ended, open chat groups were misused for spam, harassment, and inappropriate job requests. Legacy messengers had weak privacy controls and stored data offshore - safety, compliance, and trust issues for Indonesian enterprises.
//What I did
→Led 0→1 discovery, threat-modeling, and the PRD for a zero-knowledge messenger with Indonesia-only data residency.
→Designed the E2EE architecture (device-only keys, per-message ratchet, secure key backup via HSM/KMS).
→Drove delivery across Android, backend, and SecOps; ran security reviews, pen-tests, and rollout & training.
//Outcome
→Launched Indonesia's first zero-knowledge, end-to-end encrypted messenger with on-shore storage.
→Messages readable only on user devices; reduced post-project misuse via auto-archiving and strong controls.
→Cleared compliance reviews; higher enterprise adoption and trust.
0→1 Threat Modeling E2EE Android
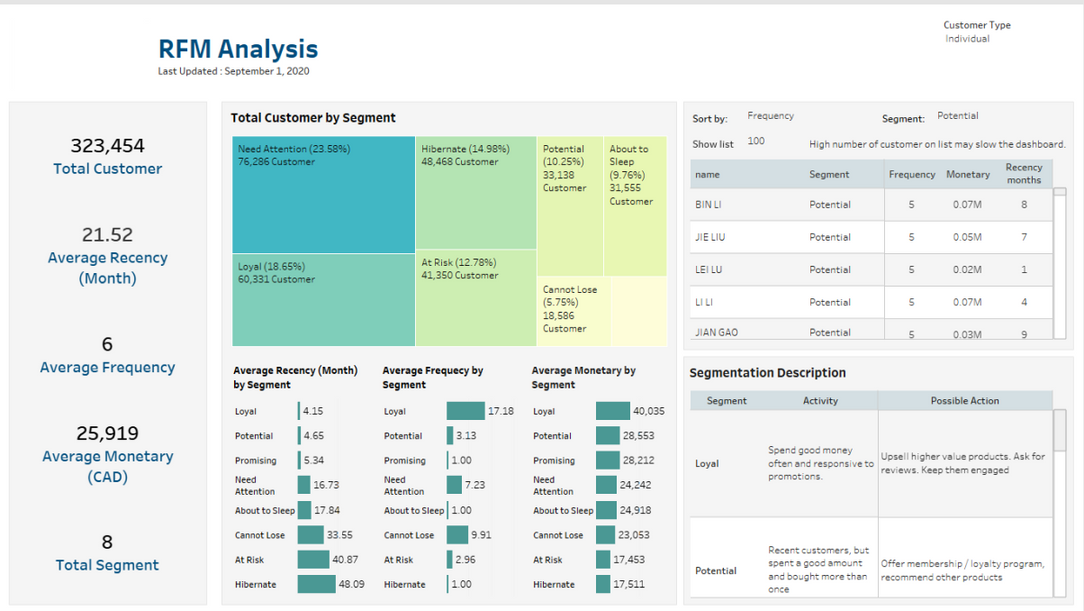
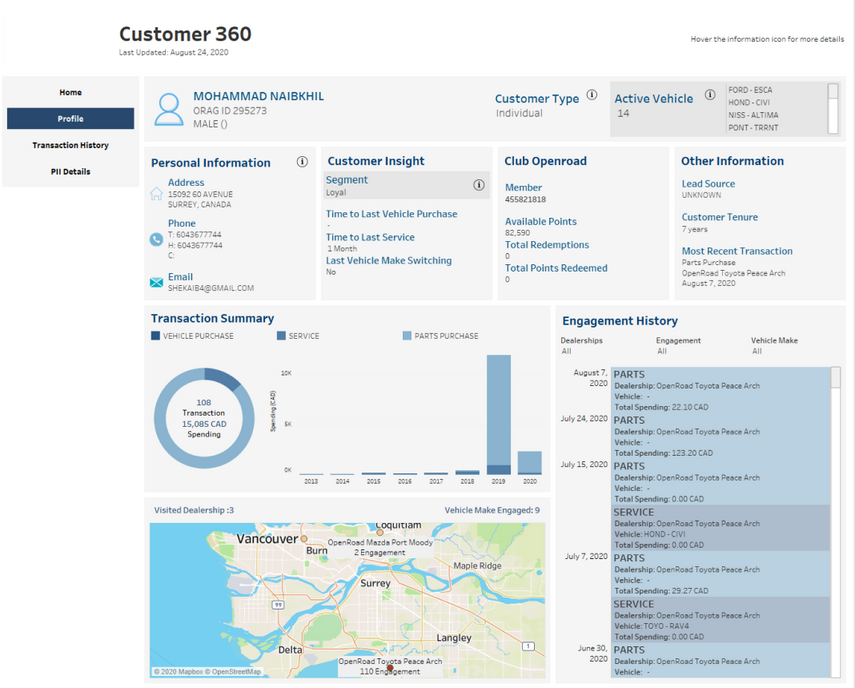
Tableau Dashboard - Automotive OEM (Canada)
//Problem
Leaders and field teams lacked a single view of the customer and business. Sales, service, and loyalty data lived in silos (DMS/CRM/e-comm). Reporting was manual and slow, and PII handling created access/compliance risk.
//What I did
→Ran discovery with Finance, Marketing, and Service to define KPIs and the decisions the dashboards must drive.
→Modeled and joined sources in SQL; set up row-level security and PII masking (tokenization / role-based access).
→Built RFM analysis and a Customer 360.
RFM analysis and Customer 360 on one governed source.
//Outcome
→One source of truth for execs and analysts; manual slide-making largely eliminated.
→Faster decisions - weekly reviews moved to daily self-serve checks.
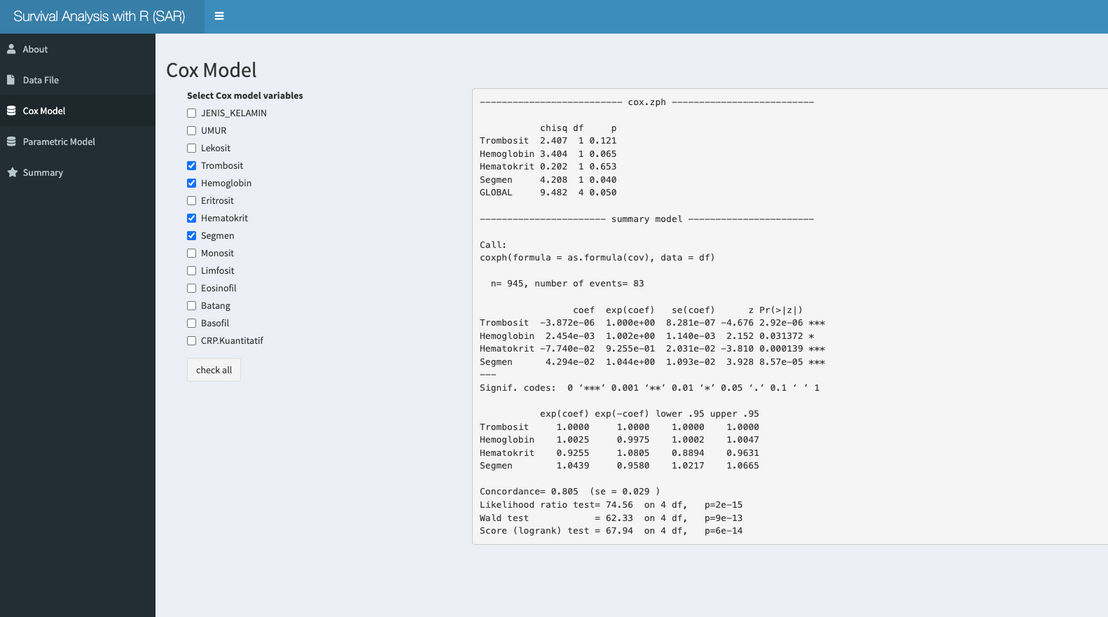
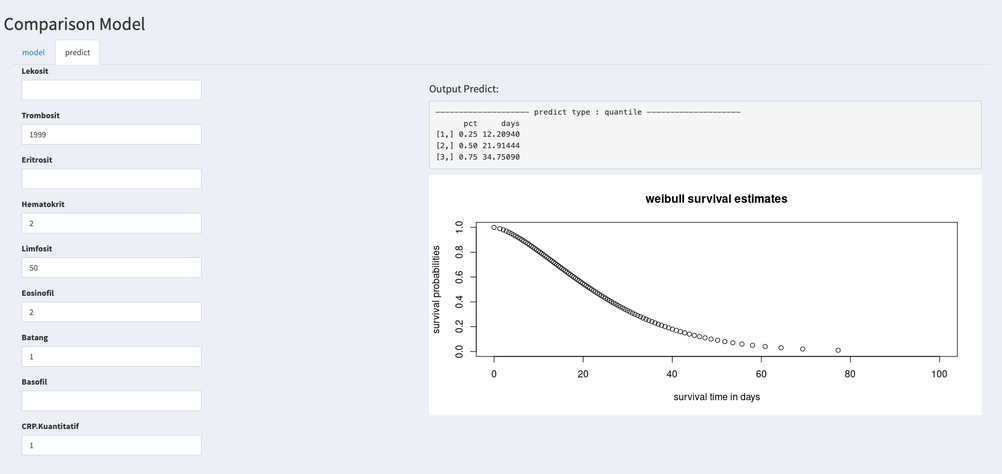
Clinicians needed survival analysis to guide care, but most lacked coding skills and compared models manually - slow, error-prone, and inconsistent across teams.
//What I did
→Created an analysis script in RStudio deployed via R Shiny; enabled CSV upload, automatic data checks, and model fitting for Cox PH plus parametric (Weibull, Exponential, Log-logistic, Log-normal) and semi-parametric approaches.
// cookies
This site uses privacy-friendly analytics. PostHog runs cookieless by default; accept to enable Mixpanel product analytics plus heatmaps & session recording (inputs always masked). See Privacy and Cookies.