· 15 min read · Jonathan Chrisnaldy
The Survey Found Indonesia's Business Owners. It Just Couldn't Count Them.
Two in five Indonesian workers work for themselves, and there are ten million more of them than a decade ago. The world's best-known entrepreneurship survey records the opposite: a fall of roughly three quarters. It turns out the survey found them. What broke was the step that decides whether a business counts.
Picture a woman who runs a warung on a side street in Bekasi. She opened it in 2016, she has never registered it with anyone, and it has fed her family every month since. Ask her what she does and she will tell you she has a business. Ask the Indonesian government and it agrees: its labour force survey counts her as an own-account worker.
She is a composite, invented to stand in for a category. The category is not invented, and it is enormous. In Indonesia’s own labour force survey, employers and own-account workers together came to 43.0 million people in 2013. By 2022 they came to 53.6 million (International Labour Organization, n.d.). That is 10.6 million more people working for themselves, a rise of about a quarter, and it takes them from 37.6% to 39.6% of everyone employed in the country.
Now the number that sent me down this hole. Over exactly those years, the Global Entrepreneurship Monitor, the survey GEM itself describes as the world’s longest-running study of entrepreneurship, recorded Indonesia losing roughly three quarters of its established business owners.
Two sources, one country, opposite directions
GEM has run since 1999 through a consortium of national research teams. Its established business ownership rate is the “percentage of 18-64 population who are currently an owner-manager of an established business, i.e., owning and managing a running business that has paid salaries, wages, or any other payments to the owners for more than 42 months” (Global Entrepreneurship Monitor, n.d.-a).
In GEM’s 2013 Indonesian round that rate was 21.2%. In 2022 it was 5.7% (Global Entrepreneurship Monitor, n.d.-b).
Put both sources on the same denominator, business owners as a share of the 18 to 64 population, and they walk away from each other. In 2013 they sat 4.0 points apart, which is about what you would expect from two instruments asking related but different questions. By 2022 they sat 22.6 points apart.
That is where I expected the story to end: a survey drifting away from the country it measures, cause unknown. Then I opened up the survey.
GEM found them
GEM’s established-ownership rate is not a question. It is a derived indicator, built in two steps. First a screening question, which asks whether you are “currently the owner of a business you help manage, self-employed, or selling any goods or services to others”. Then, for everyone who says yes, a second question: the year the business first paid you, so the 42-month rule can be applied.
The screening question is in the published data, and it does not tell the same story as the headline.
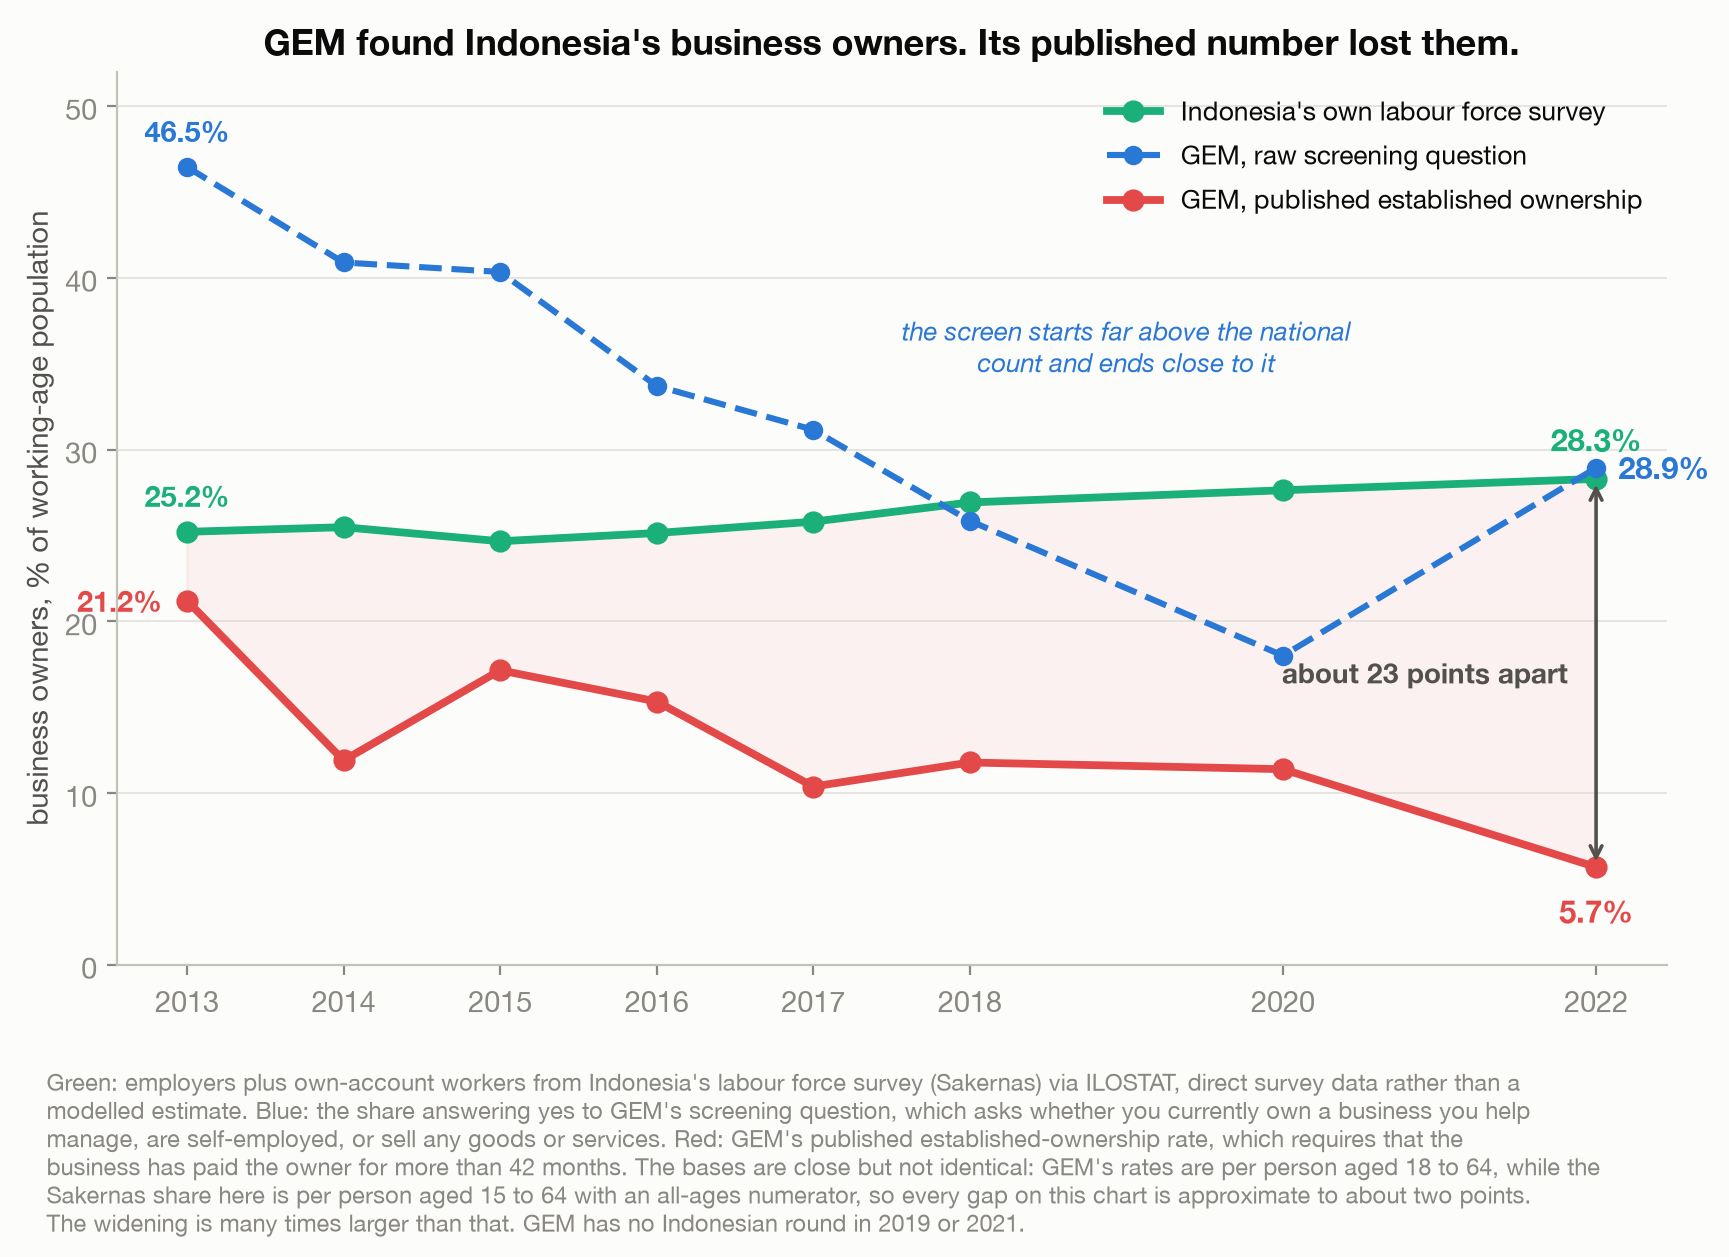
In 2013, GEM’s screen found 46.5% of Indonesian adults saying yes, running roughly twenty points above the national survey’s 25.2%. That is not surprising given how wide the question is: selling any goods or services to anyone would catch people no labour force survey classes as own-account workers.
By 2022 the screen was at 28.9%, against the national survey’s 28.3%. The two bases are not exactly aligned, so I will not claim a gap of six tenths of a point; call it close, within a couple of points either way.
So the survey found Indonesia’s business owners. In its final round it found roughly as many as the country’s own statisticians did. What collapsed was what happened to them next.
Where it breaks
Take everyone the screen catches and ask what share ends up counted as an established owner. Call it the conversion rate.
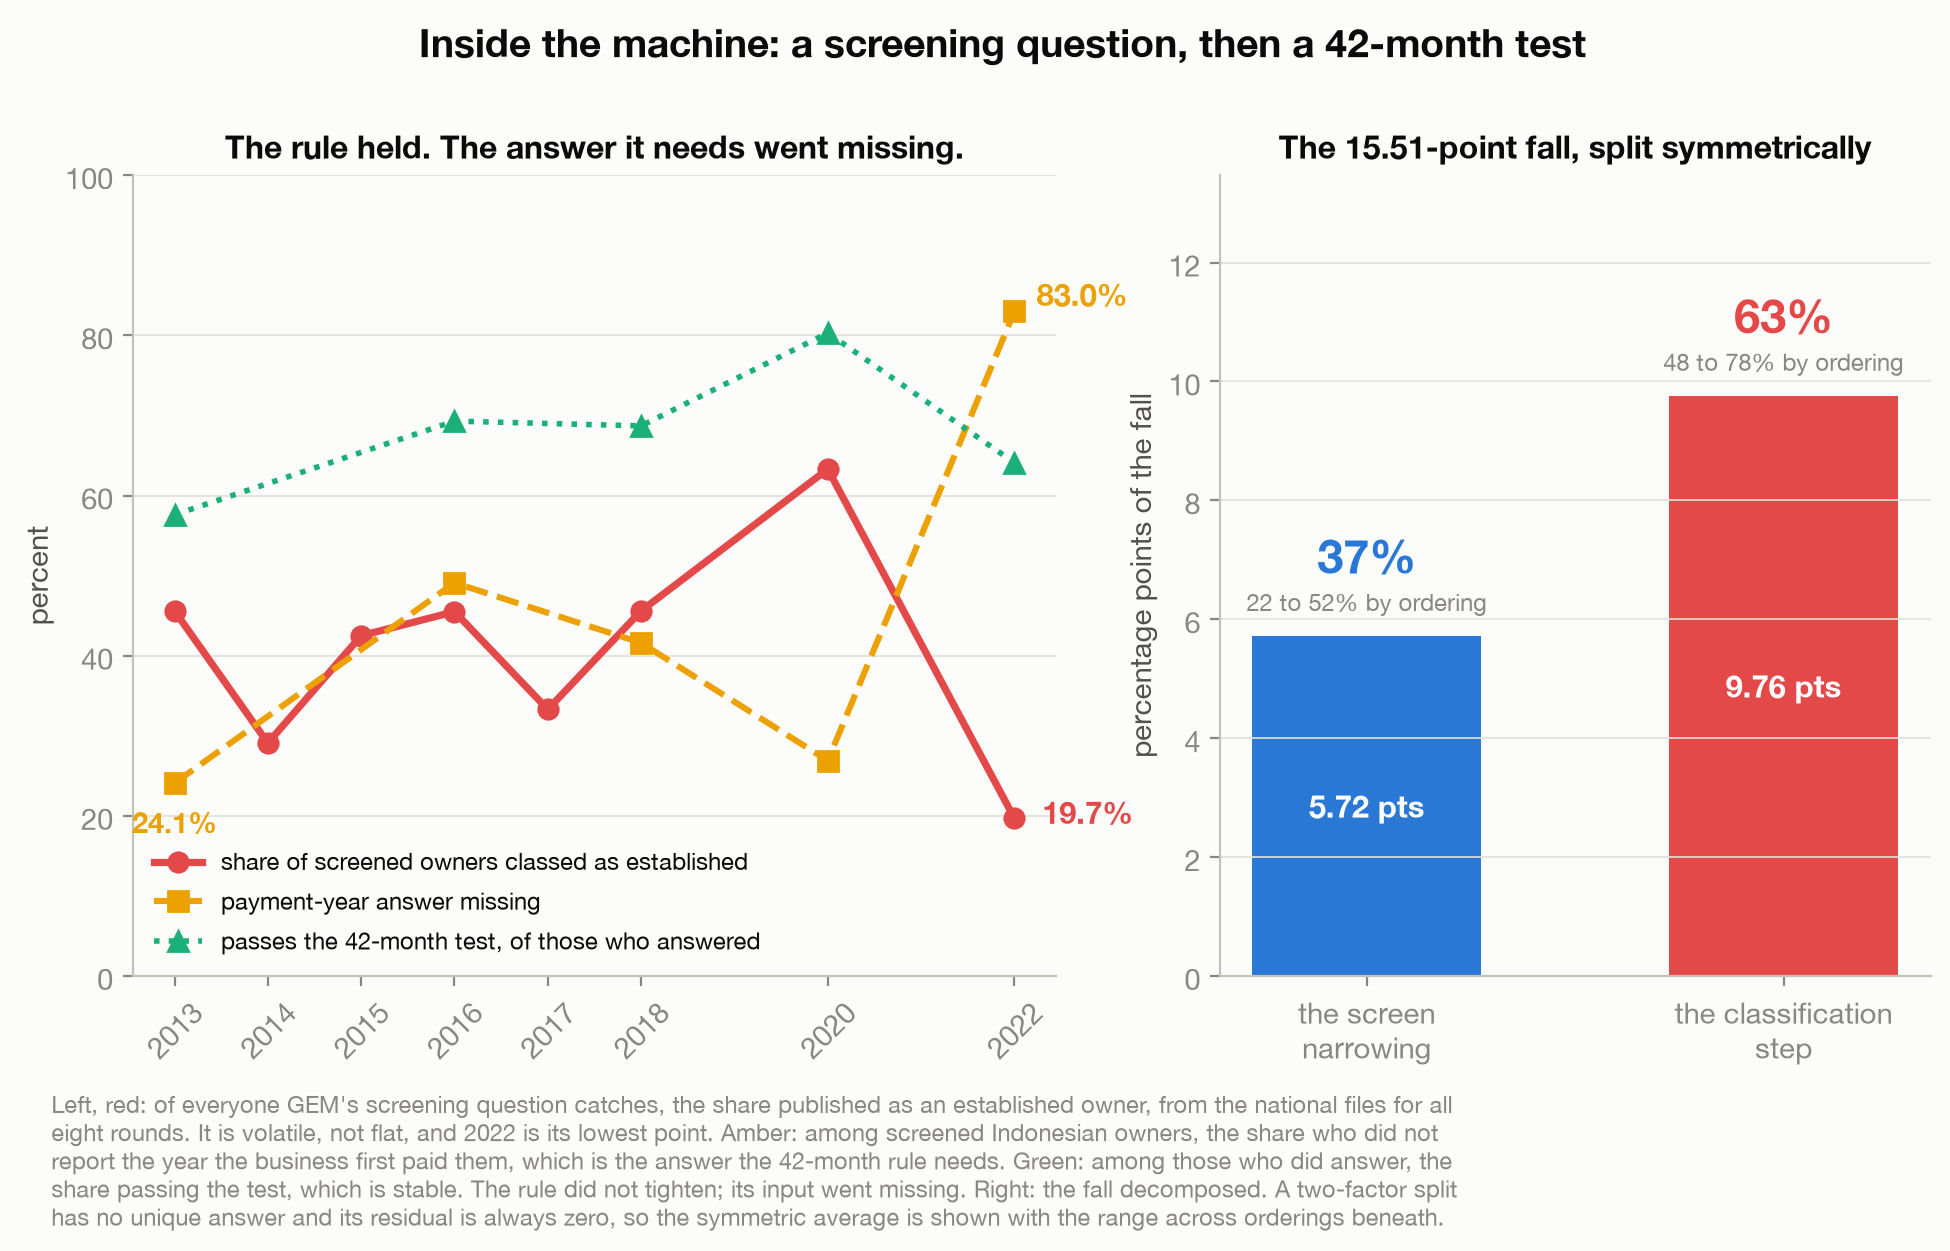
The conversion rate is not steady. Across the eight rounds it runs 45.6, 29.1, 42.5, 45.5, 33.3, 45.6, 63.3 and 19.7. Noisy, and 2022 is the lowest of the eight.
Decomposing the 15.51-point fall is less tidy than I would like. A two-factor split has no unique answer: hold the 2013 conversion rate fixed and the screen takes 52% of the blame, hold the 2022 rate fixed and it takes 22%. The symmetric average puts the screen at 37% and the classification step at 63%. The residual is zero in every version, which sounds reassuring and means nothing, because it is zero by construction.
Some of that first term is arguably the survey getting better. A screen that ran twenty points above the national count in 2013 and lands near it in 2022 has moved toward the country, not away from it. The classification term is the one with no innocent reading, and on the symmetric split it is the larger of the two.
One unanswered question
To apply a 42-month rule you need a date. GEM asks screened owners, in question Q2E2, the first year the business paid them wages, profits or payments in kind. Among Indonesians who cleared the screen, that answer was missing for 24.1% in 2013 and for 83.0% in 2022.
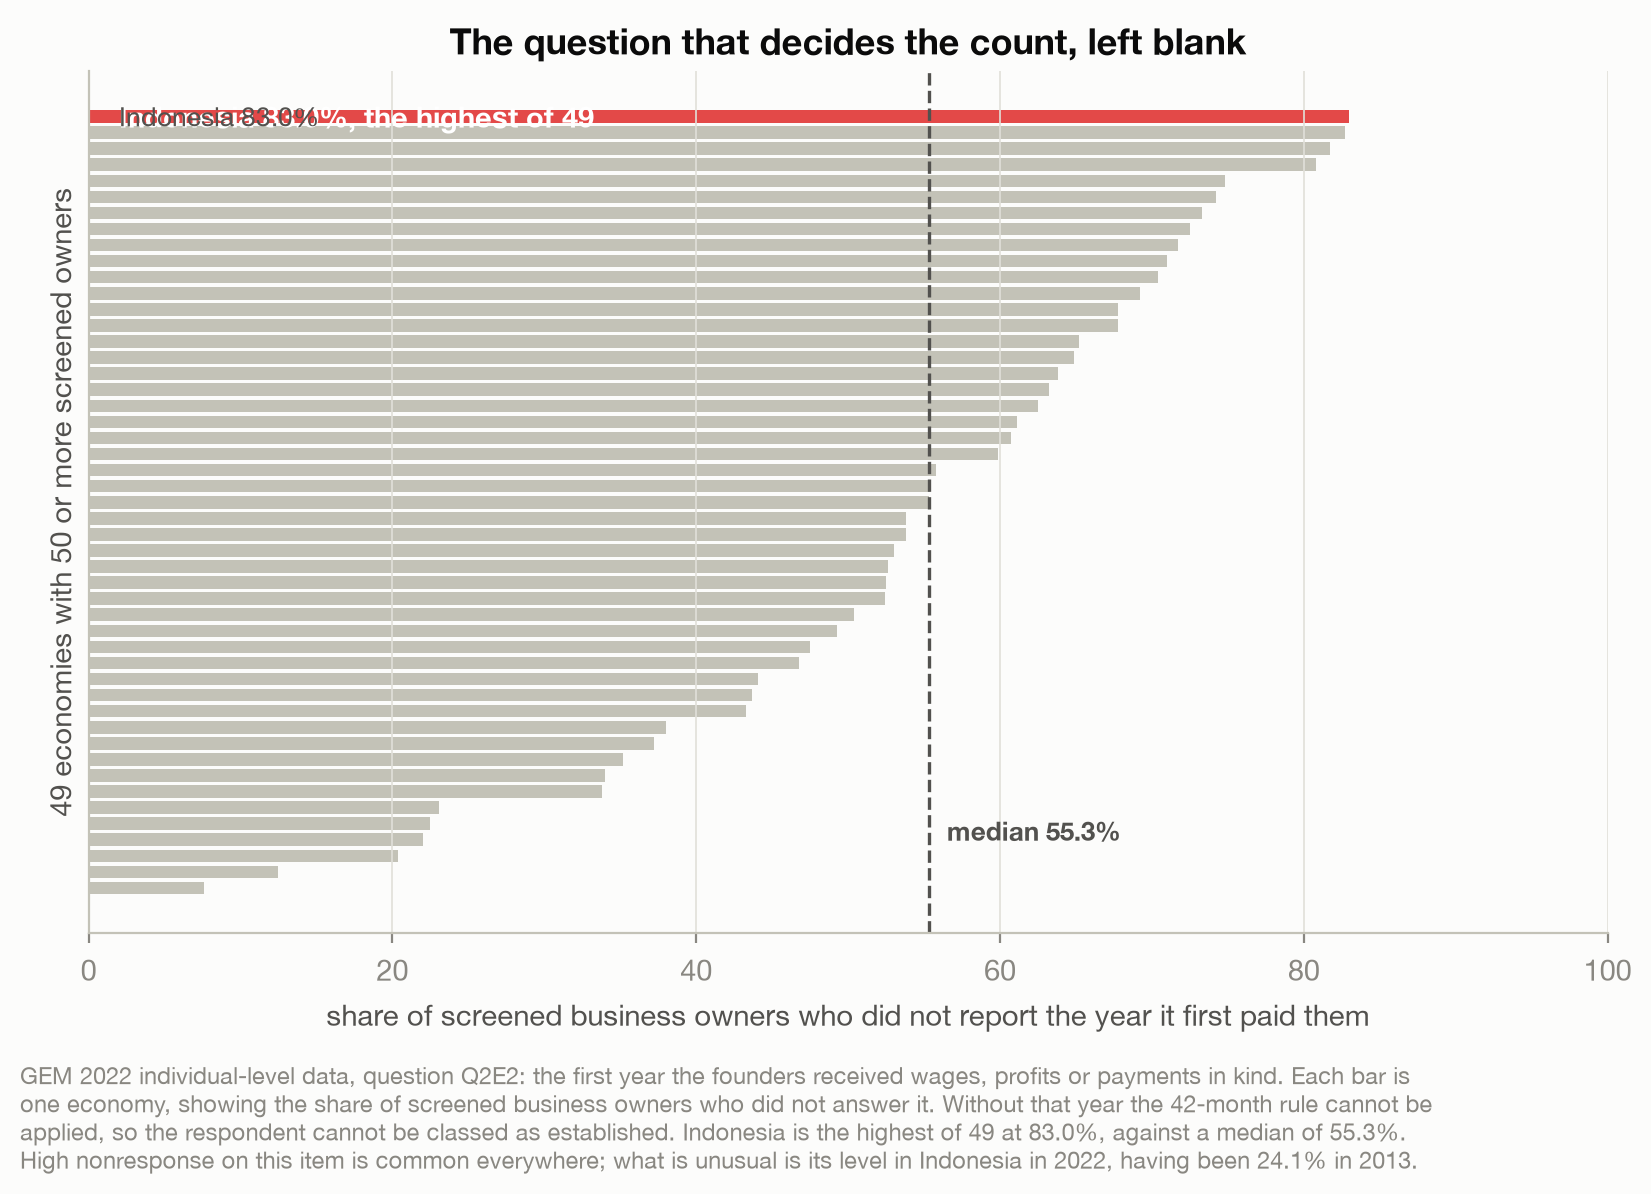
Across the 49 economies with at least fifty screened owners in 2022, the median is 55.3%. Indonesia is the highest of all of them.
Now the part that persuaded me. Among the Indonesians who did give a payment year, the share passing the 42-month test was 57.6% in 2013 and 64.1% in 2022, with 69%, 69% and 80% in the rounds between. The rule did not get harsher. Businesses were not failing the test in greater numbers. The answer the test runs on simply stopped arriving, and a respondent with no date cannot pass a rule about dates.
That is the whole mechanism. High nonresponse on this item is ordinary everywhere, and I am not claiming it is the sole cause. What the data does support is where the fall lives: not in whether Indonesians told GEM they run businesses, but in a follow-up question that went from a quarter unanswered to five sixths.
Not the boring explanations
Three duller stories deserved a hearing first, and I tested each.
The sample shrank, from 4,500 respondents in 2013 to 2,600 in 2022. Across the eight rounds, sample size and the entrepreneurship rate correlate at 0.67, which looks damning until you notice both simply decline over the decade. Holding the year constant leaves a partial correlation of 0.16. With eight rounds that is nothing anyone can interpret: the confidence interval runs from minus 0.68 to plus 0.81. The honest verdict is not that sample size is innocent, it is that eight points cannot convict or acquit it.
The sample got richer, and it genuinely did: the bottom household-income third fell from 50.5% of respondents to 37.0%, the top third grew from 13.0% to 25.8%, and the share in work fell from 76.4% to 68.5%. Reweighting the 2022 respondents to 2013’s joint profile of income, work and education recovers 4.6% of the fall in the early-stage rate and 2.9% of the fall in established ownership.
The weights are wrong. They are not, and this one runs the opposite way to the suspicion. Unweighted, Indonesia’s established ownership falls 19.5% to 6.7%. Weighted, as published, it falls 21.2% to 5.7%. Weighting makes the collapse look steeper, so it cannot be what manufactured it.
Indonesia is the worst case, not a special one
I ran the same comparison for every economy with at least five GEM rounds, measuring how far each one’s GEM ownership trend drifted from its self-employment trend over its own first-to-last span.
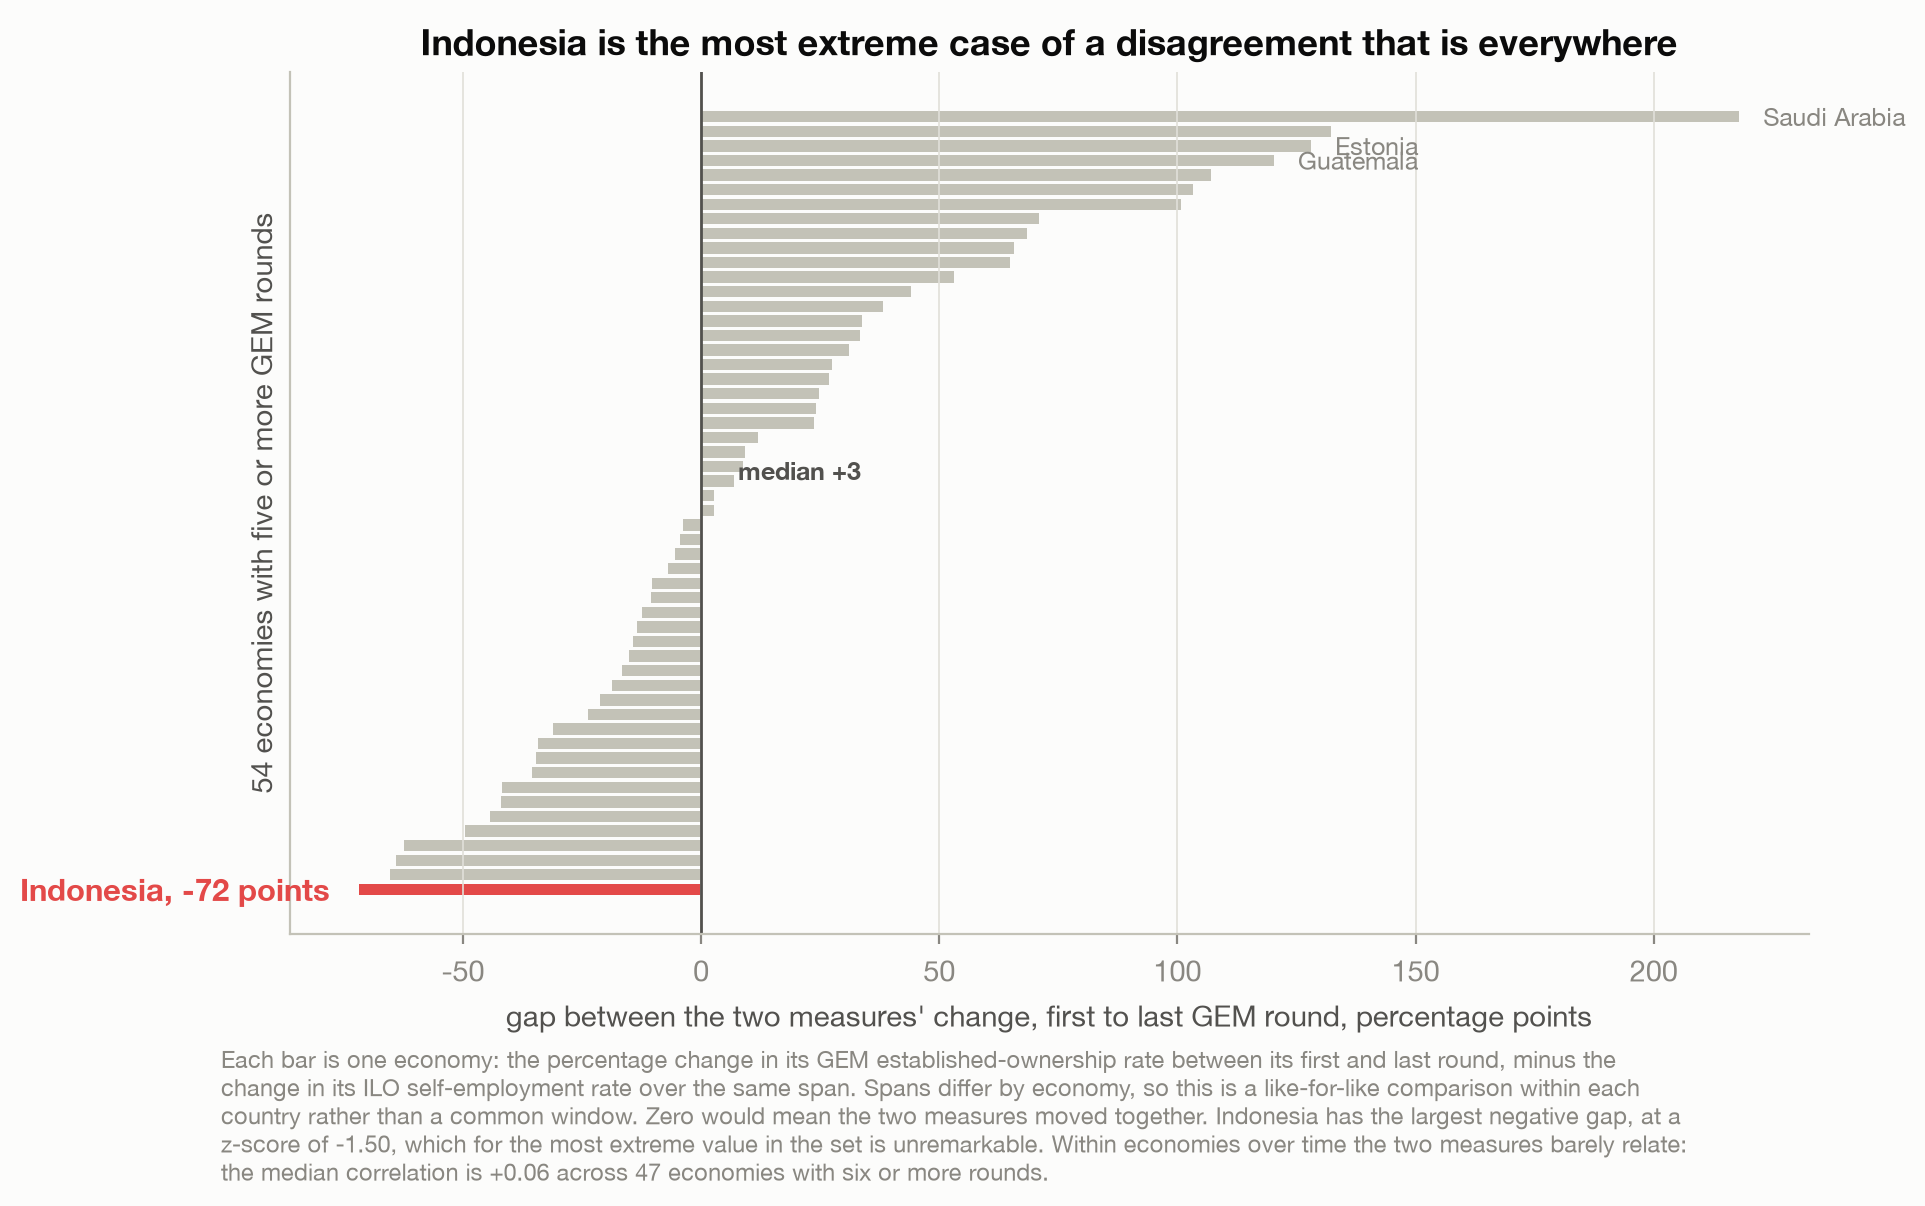
Indonesia comes last of 54. But the spread is enormous in both directions, Saudi Arabia 218 points the other way, and Indonesia’s z-score is only minus 1.50, which for the most extreme value in a set of 54 is unremarkable. Within economies over time the two measures barely relate at all: the median correlation is plus 0.06 across the 47 economies with six or more rounds.
There is a trap in that comparison worth flagging, because I fell into it. Across all participating economies the year-by-year agreement looks like it decays, from 0.65 in 2013 to 0.28 in 2022, and the difference passes a significance test. It is an artefact of the roster changing from 68 economies to 47. On the identical 35 economies present in both end years, 0.47 against 0.15 cannot be distinguished from chance. The measures did not come apart. They were never closely aligned.
The part that is GEM’s credit
Every check in this piece exists because GEM publishes its individual-level microdata, every round, on a three-year delay, as a straight download. I could open the screening question, isolate the classification step, and find the missing item because the raw records were there to open. Plenty of statistical agencies release microdata, but usually behind an application and a confidentiality declaration. Indonesia’s own Sakernas files work that way.
The transparency that let an outsider find this is the same transparency that makes the survey worth using. What I would want is not an apology but a note on the Indonesian series, flagging that the established-ownership figures are not comparable across the 2013 to 2022 span, so the next person does not build a paper on the trend.
What to do with a number you did not collect
The generalisable part is not about Indonesia and not really about GEM.
Derived indicators fail differently from questions. A question fails loudly: nobody answers, and the gap is visible. An indicator assembled from two questions fails quietly, because the failure of the second one looks exactly like a real decline in the thing the first one measured. Nothing announces it. The series arrives on schedule, formatted the same way, ready to be plotted.
The defence is dull and it works: check the trend against something collected by different plumbing, and if the two disagree, open the instrument rather than the newspaper. If they disagree by four points and then by twenty-two, you have learned something about your instrument rather than about the world.
So, back to Bekasi.
The composite warung owner opened her stall in 2016. GEM’s screening question would have found her in 2022, the same way Indonesia’s own statisticians found her and ten and a half million people like her. What it could not do was establish, from an answer she never gave, that her business had been paying her long enough to count.
She was there. She was found. She just was not counted.
Method notes
The GEM data is the Adult Population Survey: national-level files for 2013 to 2022 and individual-level files for 2013, 2016, 2018, 2020 and 2022, downloaded from gemconsortium.org. Full datasets are released three years after collection, so 2022 is the newest round. Indonesia’s continuous participation runs from 2013, with no round in 2019 or 2021; there is also an isolated earlier Indonesian round in 2006, which this analysis does not use because 2007 to 2012 are missing. Every GEM figure here is recomputed from those files.
The screen and established rates come from the published national files, so all eight Indonesian rounds are covered and the figures are GEM’s own. Nonresponse and the pass rate need respondent records, which exist for 2013, 2016, 2018, 2020 and 2022.
One caveat on the comparison that I cannot fully remove. GEM’s rates are per person aged 18 to 64. The Sakernas share here is per person aged 15 to 64, with a numerator covering everyone employed aged 15 and over. The bases are close but not identical, so every gap quoted between the two sources is approximate to about two points. The widening, from roughly four points to roughly twenty-three, is many times larger than that.
The benchmark is ILOSTAT series EMP_TEMP_SEX_STE_NB_A for Indonesia, source BA:510, which is Sakernas, Indonesia’s labour force survey, run every year. I use employers plus own-account workers and exclude contributing family workers, because GEM asks about owning and managing a business. That is a definitional choice rather than a conservative one: including family workers raises both levels and leaves the widening essentially unchanged. ILOSTAT attaches a note to the Indonesian 2013 and 2021 observations which I have not been able to resolve to a specific methodology change, and 2013 is the baseline year here, so it is worth knowing. The shared denominator is the World Bank’s working-age population series (World Bank, n.d.-a). The cross-country comparison uses the World Bank’s modelled self-employment series (World Bank, n.d.-b), because a consistent definition across a hundred economies matters more there; no single-country claim rests on it, and the Indonesian claims rest entirely on the direct Sakernas figures.
What I still cannot tell you is why the second question went unanswered so much more often in 2022. Whether the national team changed, whether fieldwork moved from face to face to telephone, whether a translation shifted: those are the candidates, and interview mode is not recorded in either individual-level file I checked, so I could not test it. I can localise the failure to the classification step and quantify it. I cannot name its cause.
Four corrections after earlier drafts, all mine, all the same mistake: reading a variable name instead of its label. An earlier version used ESTBBUS1, “value before reclassification”, instead of the published ESTBBUSO. Another used omyr5job, which is a five-year headcount projection, as the payment-year question instead of omwageyr. Another used the raw ownmge screen instead of OWNMGEyy, the version the published rate actually equals. And another double-counted four economies whose names GEM spells two ways. The repo records all four, because the fix is procedural: read the label first, every time.
I found GEM through the Data Is Plural newsletter, which is where a good deal of this series’ raw material starts (Singer-Vine, 2024).
The analysis code is on GitHub.
References
Global Entrepreneurship Monitor. (n.d.-a). GEM definitions. Retrieved July 29, 2026, from https://www.gemconsortium.org/wiki/1154
Global Entrepreneurship Monitor. (n.d.-b). GEM Adult Population Survey national-level data 2013 to 2022, and individual-level data for 2013, 2016, 2018, 2020 and 2022 [Data sets]. Retrieved July 29, 2026, from https://www.gemconsortium.org/data/sets?id=aps
International Labour Organization. (n.d.). Employment by sex and status in employment, Indonesia [Data set, EMP_TEMP_SEX_STE_NB_A, source BA:510, Sakernas]. ILOSTAT. Retrieved July 29, 2026, from https://rplumber.ilo.org/data/indicator/?id=EMP_TEMP_SEX_STE_NB_A&ref_area=IDN&format=.csv&channel=ilostat
Singer-Vine, J. (2024, May 8). Data Is Plural: 2024.05.08 edition. https://www.data-is-plural.com/archive/2024-05-08-edition/
World Bank. (n.d.-a). Population ages 15-64, total: Indonesia [Data set, SP.POP.1564.TO]. Retrieved July 29, 2026, from https://data.worldbank.org/indicator/SP.POP.1564.TO
World Bank. (n.d.-b). Self-employed, total (% of total employment), modeled ILO estimate [Data set, SL.EMP.SELF.ZS]. Retrieved July 29, 2026, from https://data.worldbank.org/indicator/SL.EMP.SELF.ZS
// About the author
Jonathan Chrisnaldy is a product manager and analyst in New York City, with an M.S. in Technology Management from Columbia University. He writes data stories about the numbers behind everyday claims. More on the experience page or LinkedIn.