· 14 min read · Jonathan Chrisnaldy
Reading Part of One Sentence Counts as Literate
The world's most-used household survey decides you can read if you finished secondary school, or read a sentence off a card, or read part of one. Of 686 country-years where UNESCO records how a literacy rate was produced, 52 came from an actual test. Of the 60 countries reporting 95% literacy or better, 54 have never been recorded administering one.
Here is how one of the world’s most-used household surveys decides whether you can read. It is one line of Stata, published openly by the people who wrote it:
replace rc_litr=1 if v106==3 | v155==1 | v155==2v106==3 means you have more than a secondary education. v155==2 means you were handed a card
and read the sentence on it. v155==1 means you read part of the sentence.
Any one of the three makes you literate. And the first one is not a result. If you finished more than secondary school you are never handed the card at all, because the survey does not ask (The DHS Program, 2026a). So for anyone with enough schooling, the indicator has no state that means “this person cannot read.”
I went looking for how the world got literate. What I found was mostly a question about how we decided to ask.
What a literacy rate is made of
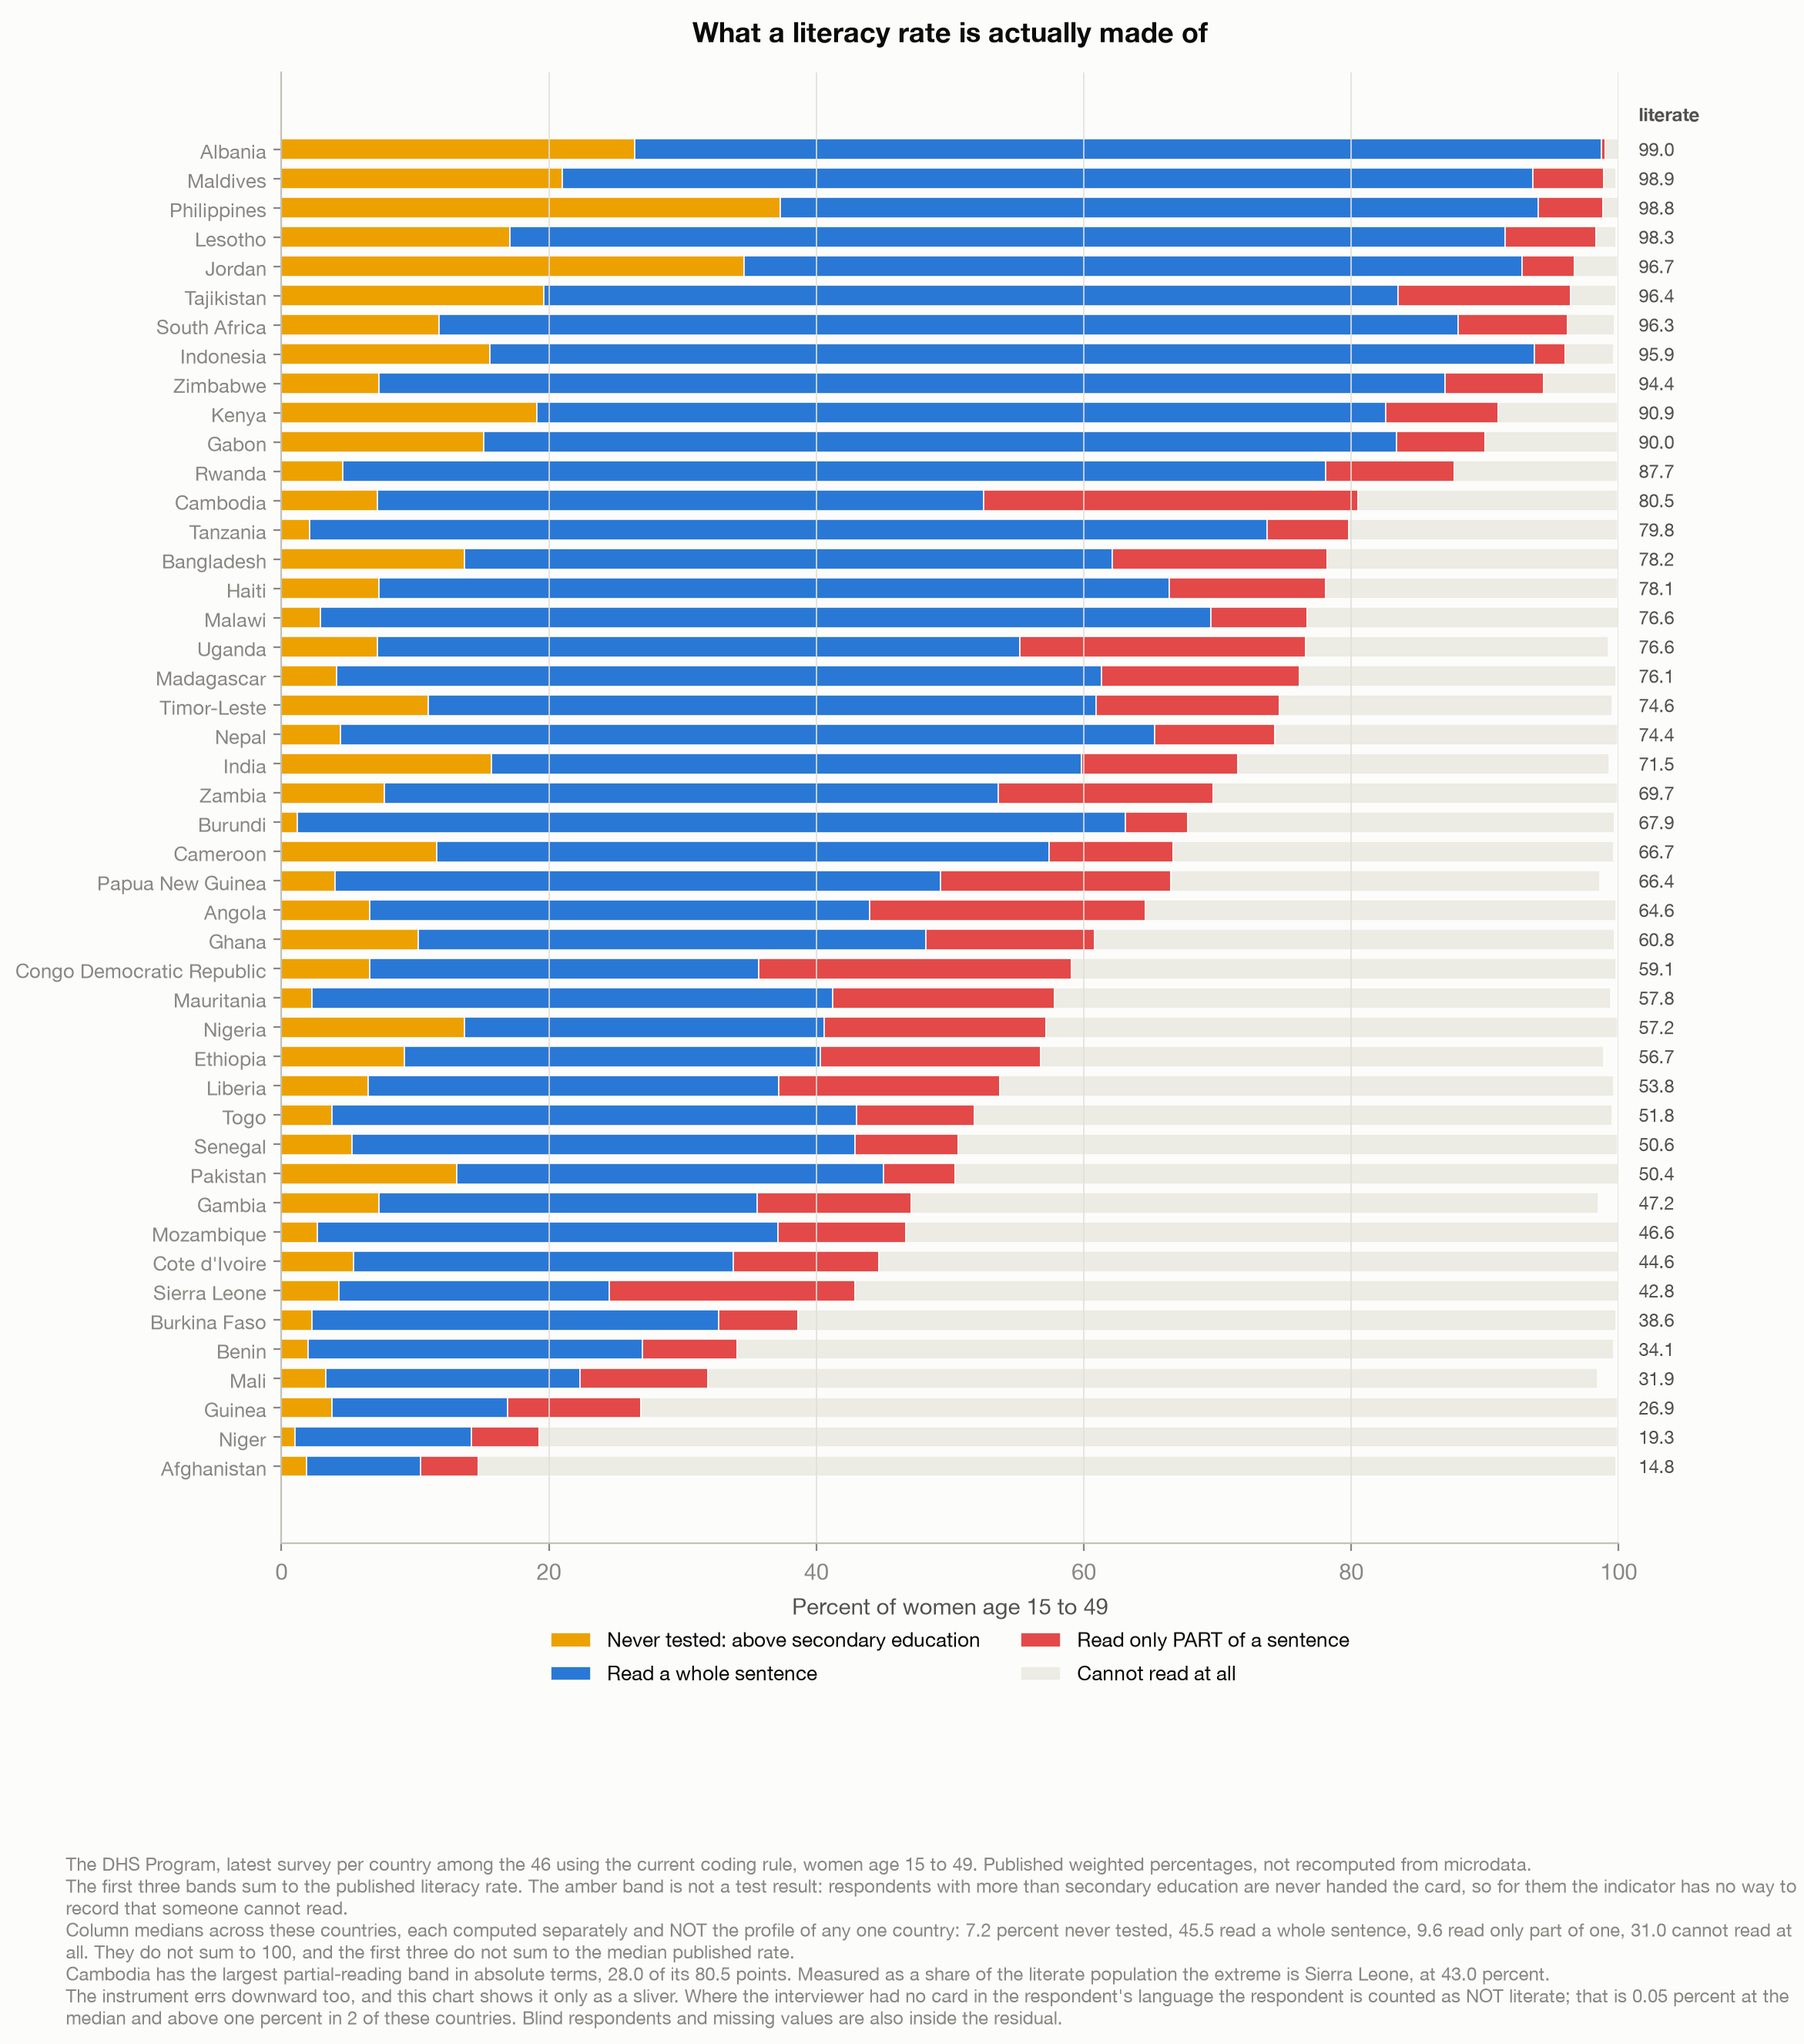
Take the 46 countries measured under the current rule. Most of the people counted literate did read a whole sentence off the card: that band is 45.5 points at the median, about 68% of the median country’s literate population. The argument here is not that the rate is mostly fiction. It is about the other third. The median never-tested share is 7.2 points and the median partial-reader share is 9.6. Those are two separate medians across the same set of countries, not a description of one country: no country in the group sits at both.
Individual countries go much further. Cambodia reports 80.5% literate, and 28.0 of those points are partial readers, the largest such band anywhere in the group. Measured as a share of the literate population rather than of everyone, Sierra Leone is the extreme: 43.0% of the Sierra Leoneans counted as literate read part of a sentence and no more. In the other direction, the Philippines reports 98.8%, of which 37.3 points were never asked to read anything.
None of that is hidden. It is four columns of a published table, and I got all of it from a free API with no registration.
The instrument also fails the other way, and less conveniently for my argument. If the interviewer had no card in the respondent’s language, the respondent is counted as not literate. Read fluently in a language nobody brought a card for and you are recorded as illiterate. It is small, under a tenth of a percent at the median and above one percent in only two of these countries, but it is there, and it means the measure is not simply generous. It is narrow in both directions.
The year the instrument changed
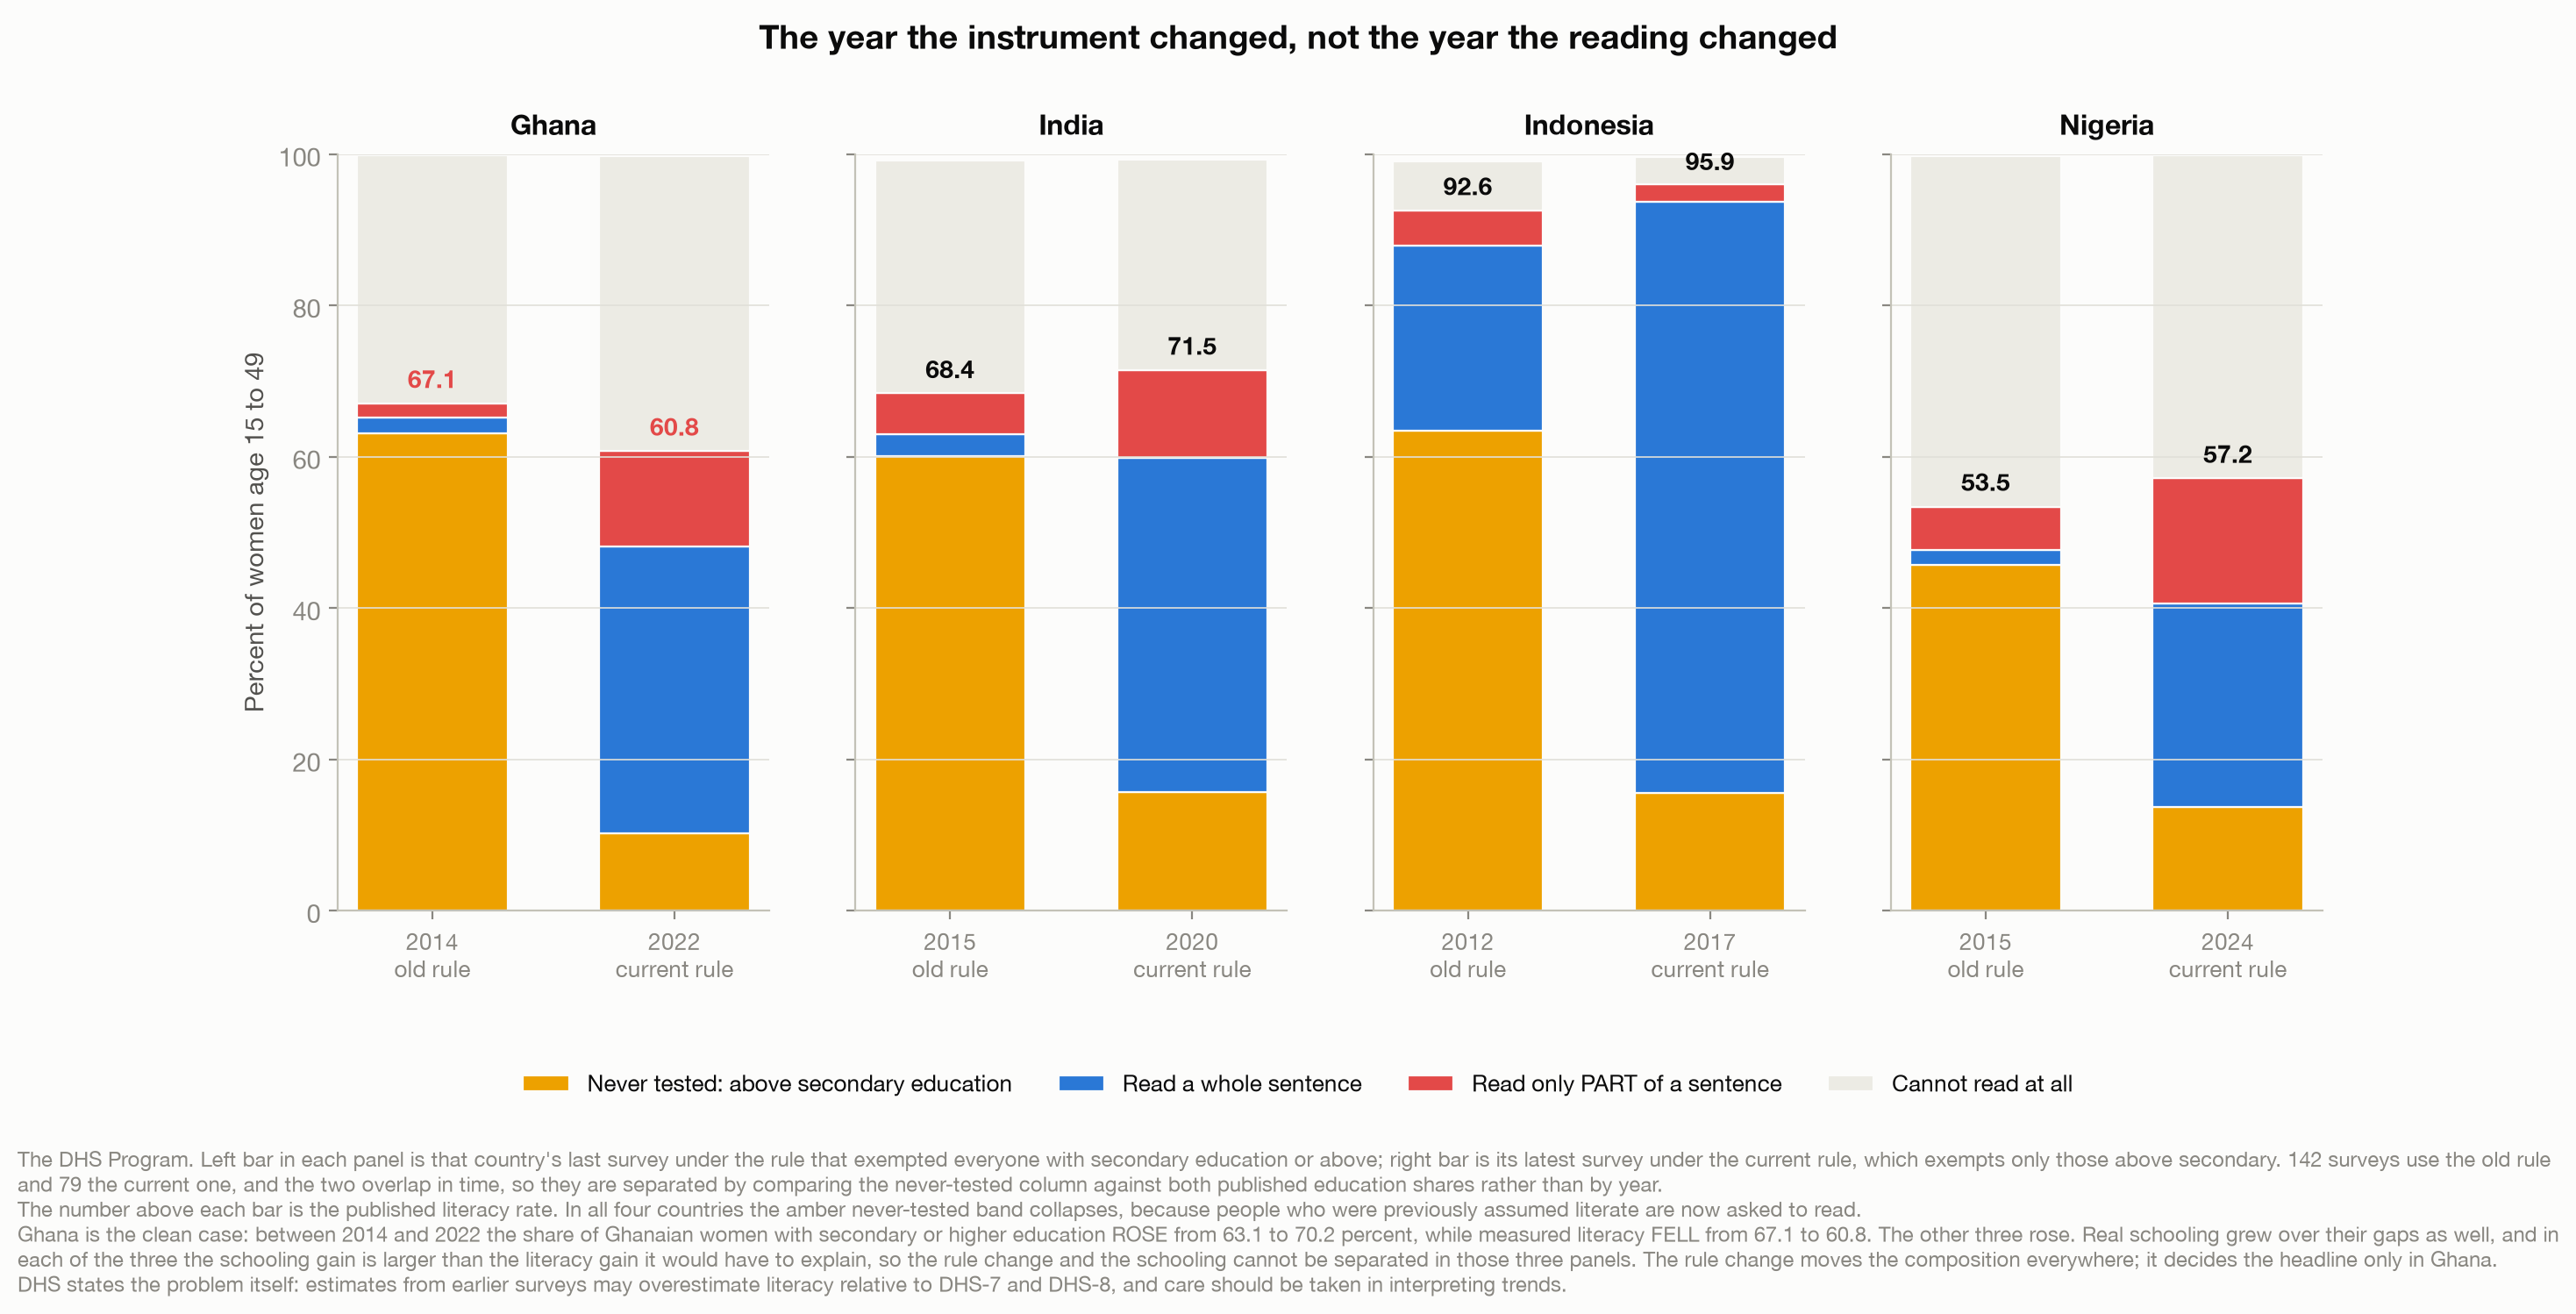
The rule I quoted is the current one. It used to be looser: nobody with secondary education or above was handed a card. DHS tightened it, and says so plainly, warning that its own earlier estimates “may overestimate literacy” and that “care should be taken in interpreting trends” (The DHS Program, 2026a).
Watch what happens in Ghana. Between its 2014 and 2022 surveys, the share of Ghanaian women with secondary or higher education rose from 63.1 to 70.2%. Measured literacy fell, from 67.1 to 60.8.
Ghanaian women did not forget how to read. They started being asked. In 2014, 63.1 of Ghana’s 67.1 literacy points were people who were never handed a card: 94% of the country’s literacy rate was an assumption.
I have to be careful here, because the other three countries went the other way. India, Indonesia and Nigeria all rose across the same change. Real schooling grew over their gaps as well, and it grew fastest in the two short ones: India added 5.7 points of secondary-or-higher education in five years and Indonesia 7.5, more per year than Nigeria managed across nine. Each of those rises is larger than the literacy rise it would have to explain, so in these three panels I cannot separate the rule change from the schooling. The composition moves everywhere, and you can see the exempted band collapse in all four panels. But of these four the headline only fell in Ghana. These four are worked examples, not the evidence: 39 countries have surveys under both rules, and five of those headlines fell. In three of the five, Ghana among them, education rose by more than five points while measured literacy went down.
What it did do everywhere is convert assumption into evidence. That is a different and better claim, and it survives all four.
How these numbers are actually made
DHS at least hands somebody a card. Most of the world’s literacy statistics do not come from DHS.
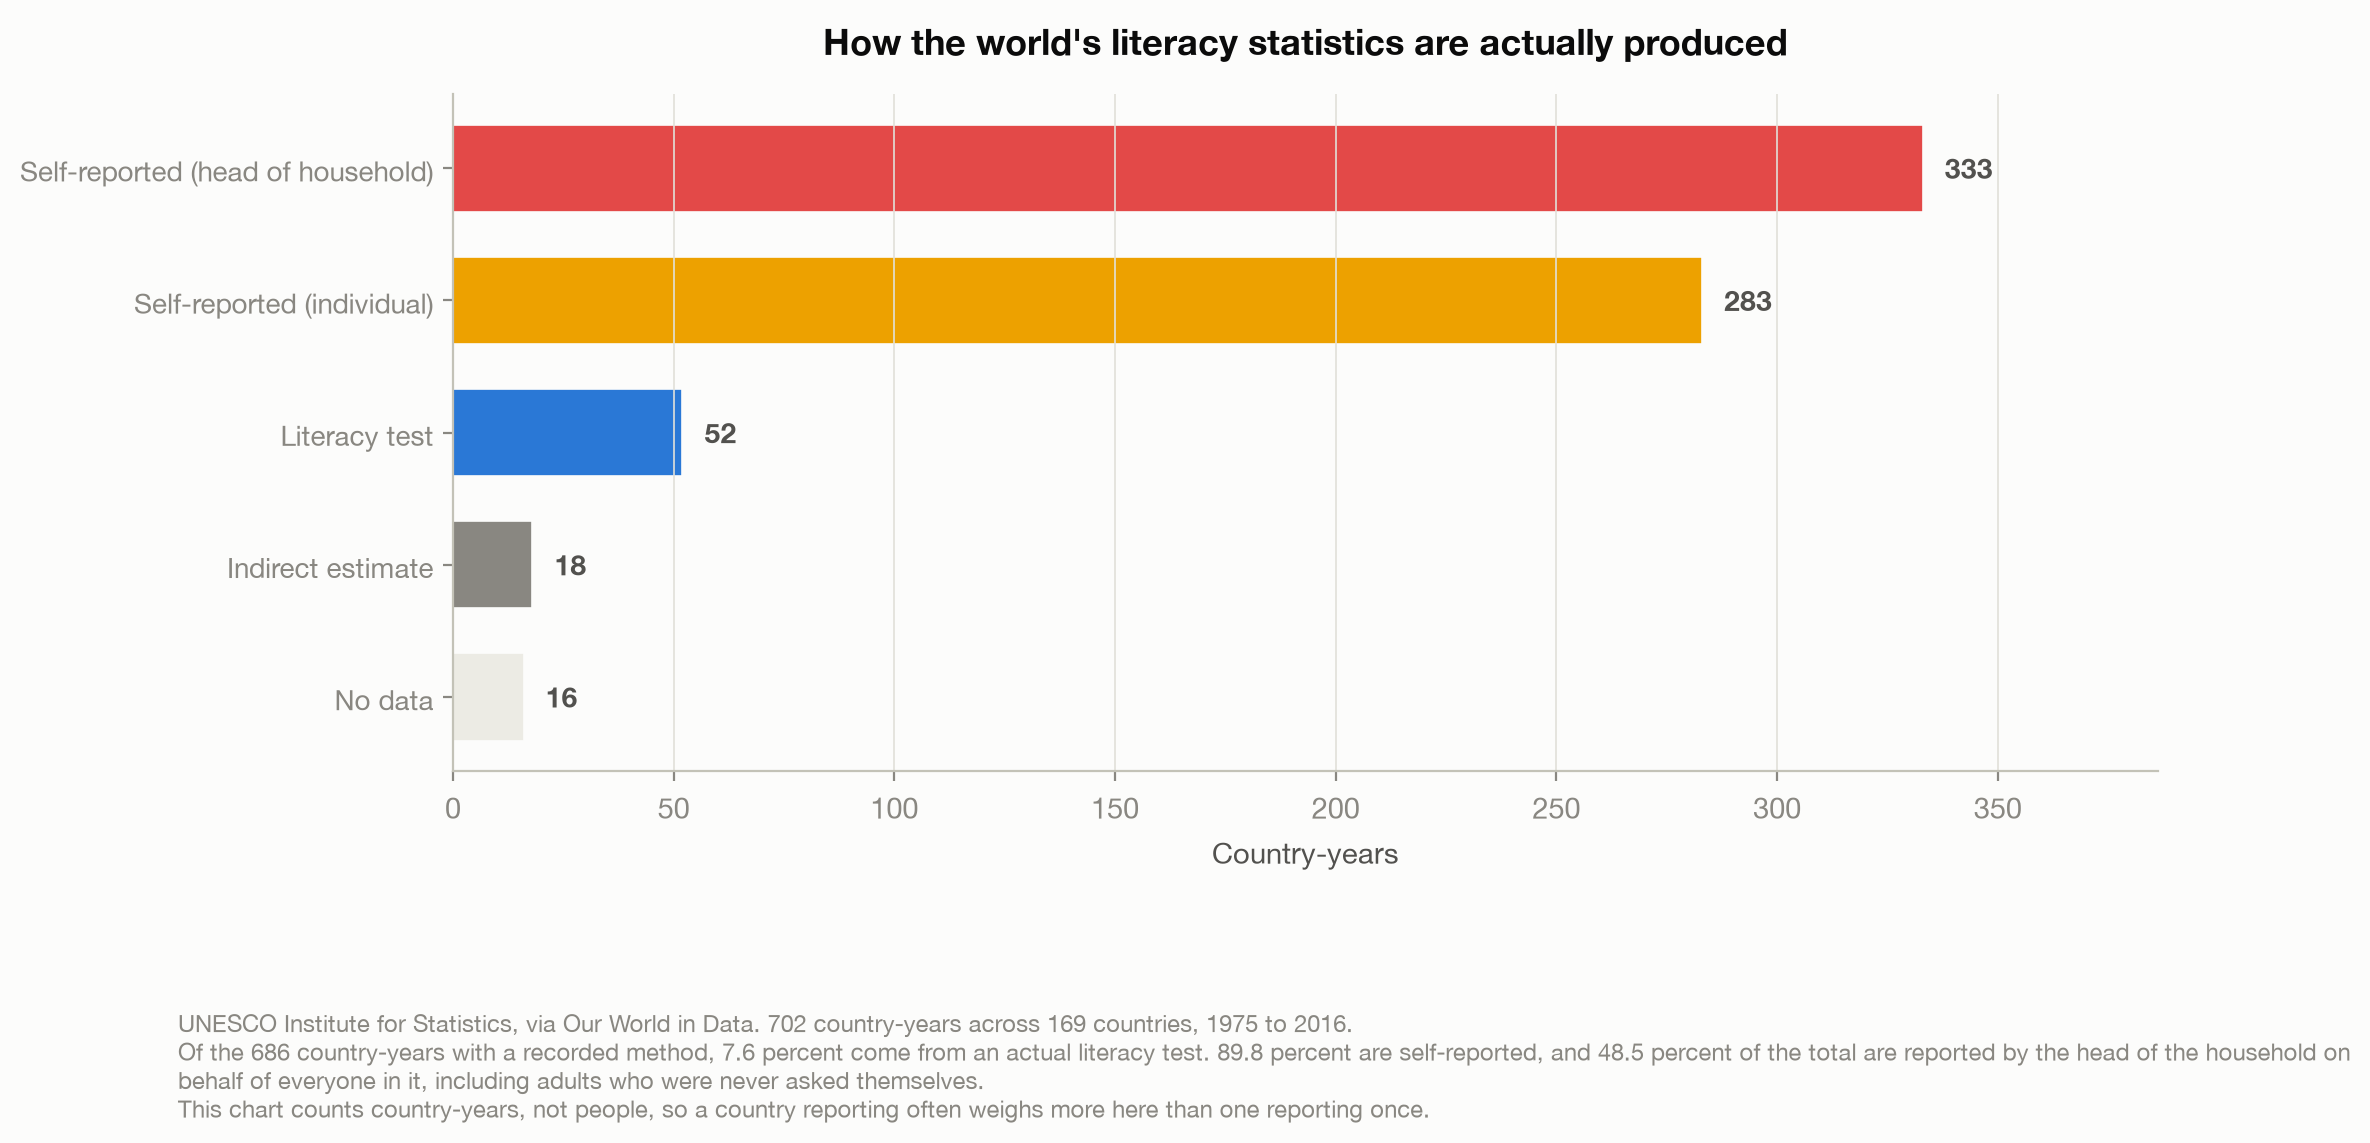
UNESCO records how each country produced its figure. Across 686 country-years, 52 came from an actual literacy test. That is 7.6%. Almost everything else is a declaration: 89.8% of those country-years are self-reported, and a further 18 are modelled estimates.
And the largest single category is not people describing their own reading. It is 333 country-years of literacy reported by the head of the household on behalf of everyone in it: a spouse, adult children, an elderly parent, all assessed by one person who was not asked to check.
This counts country-years rather than people, so a country that reports often weighs more here than one that reports once. The shape does not depend on that. Testing is the exception everywhere.
Who gets asked to prove it
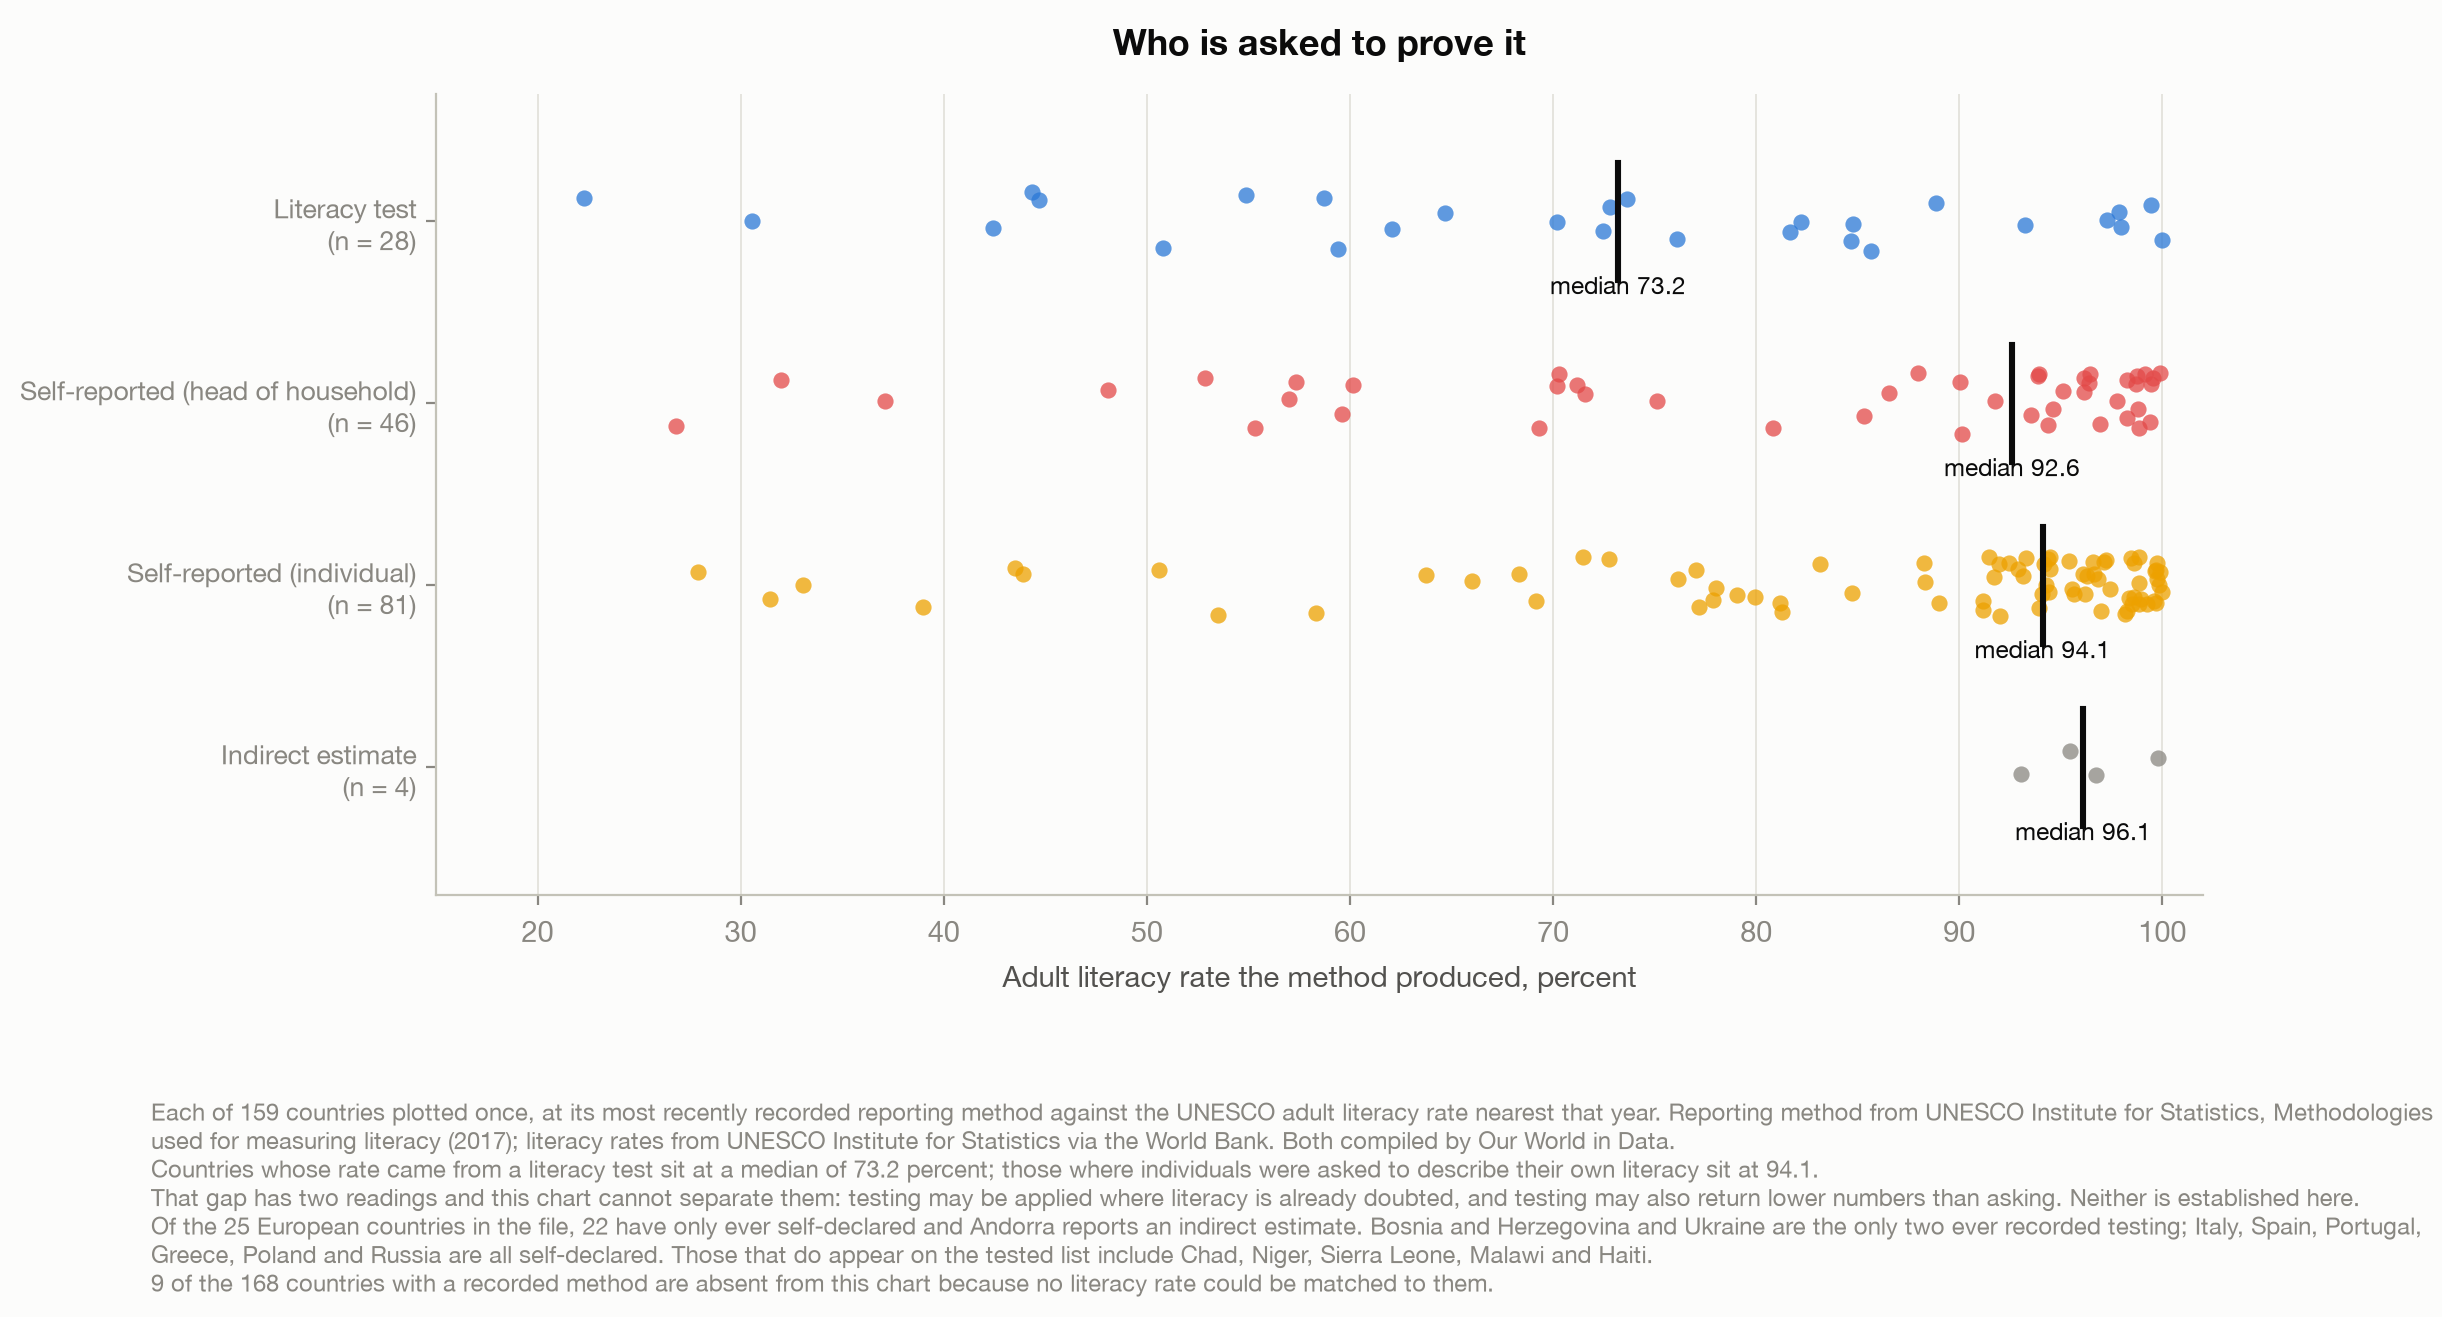
Forty countries have ever been recorded administering a literacy test. A hundred and twenty-nine have not.
Look at which is which. Of the 25 European countries in the file, 22 have only ever self-declared and one, Andorra, reports an indirect estimate. Exactly two have been recorded administering a test: Bosnia and Herzegovina and Ukraine. Italy, Spain, Portugal, Greece, Poland and Russia are all self-declared. The countries that do appear on the tested list include Chad, Niger, Sierra Leone, Malawi and Haiti.
Countries whose rate came from a test sit at a median literacy of 73.2%. Countries where individuals described their own literacy sit at 94.1.
That gap has two readings and this data cannot separate them. Testing may be applied where literacy is already doubted, which would make the gap a selection effect. Or testing may simply return lower numbers than asking, which would make it an instrument effect. I can tell you the pattern exists; I cannot tell you the split, and anyone who does is guessing.
The pattern is also not clean, and I want to say so before someone else does. Plenty of countries with low measured literacy have never been tested either. Of the 15 countries whose literacy sat under 50% when their reporting method was last recorded, 9 have only ever been asked: South Sudan at 26.8 in 2008, Burkina Faso at 27.9 in 2007, Afghanistan at 31.4 in 2011. So this is not a tidy rule that scrutiny follows doubt.
What survives is narrower. Of the 60 countries reporting 95% literacy or better, 54 have never been recorded administering a test. Near-universal literacy is, nearly everywhere, a number nobody has been asked to demonstrate.
The two instruments do not agree, either. Where DHS survey estimates and UNESCO official estimates both cover a country, UNESCO reads as much as 15.9 points higher (Pakistan) and 11.7 points lower (East Timor, which the first chart labels Timor-Leste), around a mean gap of just 1.8. The differences point both ways, so the average conceals the disagreement rather than dissolving it.
What this does and does not prove
It does not prove the world is less literate than reported. I want to be precise about that, because it is the conclusion this post is easiest to misread into. The reported figure is not built to answer that question, and almost nobody has run the measurement that would.
What it proves is narrower. The word “literate” carries an everyday meaning: you can read things that matter, a contract, a prescription label, a ballot. The indicator certifies one of three things: that you attended enough school, or that you read one sentence, or that you got through part of one. The middle path is the commonest, and it is still a single sentence.
All three were reasonable when the achievement being tracked was getting anyone to read at all. A threshold built for a world of mass illiteracy is not obviously the right threshold for a world where reading a bus timetable is the floor for participating. The measure did not decay. The question changed underneath it.
And that is the part worth carrying somewhere else. This indicator is not incapable of returning a low number: it reports 14.8% for Afghan women aged 15 to 49 and 19.3 for Niger, and ten of the 46 countries come in under half. What it cannot do is fail downward by much. The two choices that move the most points, exempting the people most likely to pass and counting partial success as success, both push upward. Every choice that pushes the other way is worth a fraction of a point at the median, including the one that counts a fluent reader as illiterate when no card was available in her language, worth 0.05. It is not that the number is wrong. It is that nothing in its construction is trying to catch it being too high.
A measure that cannot record one person’s failure cannot certify that person’s success.
Method notes
Two time bases. DHS surveys at their own fieldwork years, running to 2025, and UNESCO’s record of reporting method, which ends in 2016. Anything I say about the present rests on the first.
Two populations, not one. The composition figures are DHS’s published table for women aged 15 to 49. UNESCO’s adult rate is everyone 15 and over. These are different universes measured different ways, and I have not averaged or merged them anywhere. The one place they appear side by side, the disagreement above, uses a third series: Our World in Data’s compilation of DHS survey estimates across all respondents, which is not the women 15 to 49 table either. Three constructions, never combined.
The rule change is identified from the data, not assumed. DHS publishes no survey phase in its API, survey type does not track the change, and the two regimes overlap in time, so a year cutoff misclassifies surveys. Each survey is assigned by comparing its never-tested column against two separately published education shares. Surveys match their assigned rule to a mean of 0.005 points and miss the alternative by 32.9. 221 of 226 classify; the 5 that do not are named in the repository.
Percentages are DHS’s own published weighted estimates, read from its public API. Nothing here was recomputed from microdata, and the eight columns of every survey are checked to sum to 100.
The analysis, the four charts and every number above are reproduced by the code in the data-stories repository. The source files are not redistributed; a fetch script downloads them from the DHS API and Our World in Data.
References
Our World in Data. (2026a). Literacy. Retrieved August 9, 2026, from https://ourworldindata.org/literacy
Our World in Data. (2026b). Literacy rates, survey estimates vs. official UNESCO estimates [Data set]. Compiled from DHS Program (2018) and UNESCO UIS Data API, via World Bank (2026). https://ourworldindata.org/grapher/literacy-rate-adult-total-dhs-surveys-vs-unesco
The DHS Program. (2026a). Guide to DHS statistics: Literacy. ICF. https://dhsprogram.com/data/Guide-to-DHS-Statistics/Literacy.htm
The DHS Program. (2026b). DHS program API: Data and indicator endpoints [Data set]. ICF. https://api.dhsprogram.com/rest/dhs/data
The DHS Program. (2026c). DHS-Indicators-Stata: Chapter 3, respondents’ characteristics [Source code]. GitHub. https://github.com/DHSProgram/DHS-Indicators-Stata
UNESCO Institute for Statistics. (2017). Methodologies used for measuring literacy [Data set]. With minor processing by Our World in Data. https://ourworldindata.org/grapher/mode-of-reporting-literacy-rates
// About the author
Jonathan Chrisnaldy is a product manager and analyst in New York City, with an M.S. in Technology Management from Columbia University. He writes data stories about the numbers behind everyday claims. More on the experience page or LinkedIn.