· 24 min read · Jonathan Chrisnaldy
Greed You Can Regulate. Difficulty You Have to Pay For.
Road deaths are almost exactly where they were in 2000, and only a quarter of the dead were inside a four-wheeled vehicle. Across 34 diseases, how much damage a condition does explains about 9 percent of how much it gets studied. What predicts research effort is duller and worse: whether there is something to aim at.
With all of this, the satellites and the models and the biotech, does any of it make life better, or is it just about money?
I went looking. The question has a third answer, worse than either.
The car got rebuilt. Most of the people it kills were never inside it.
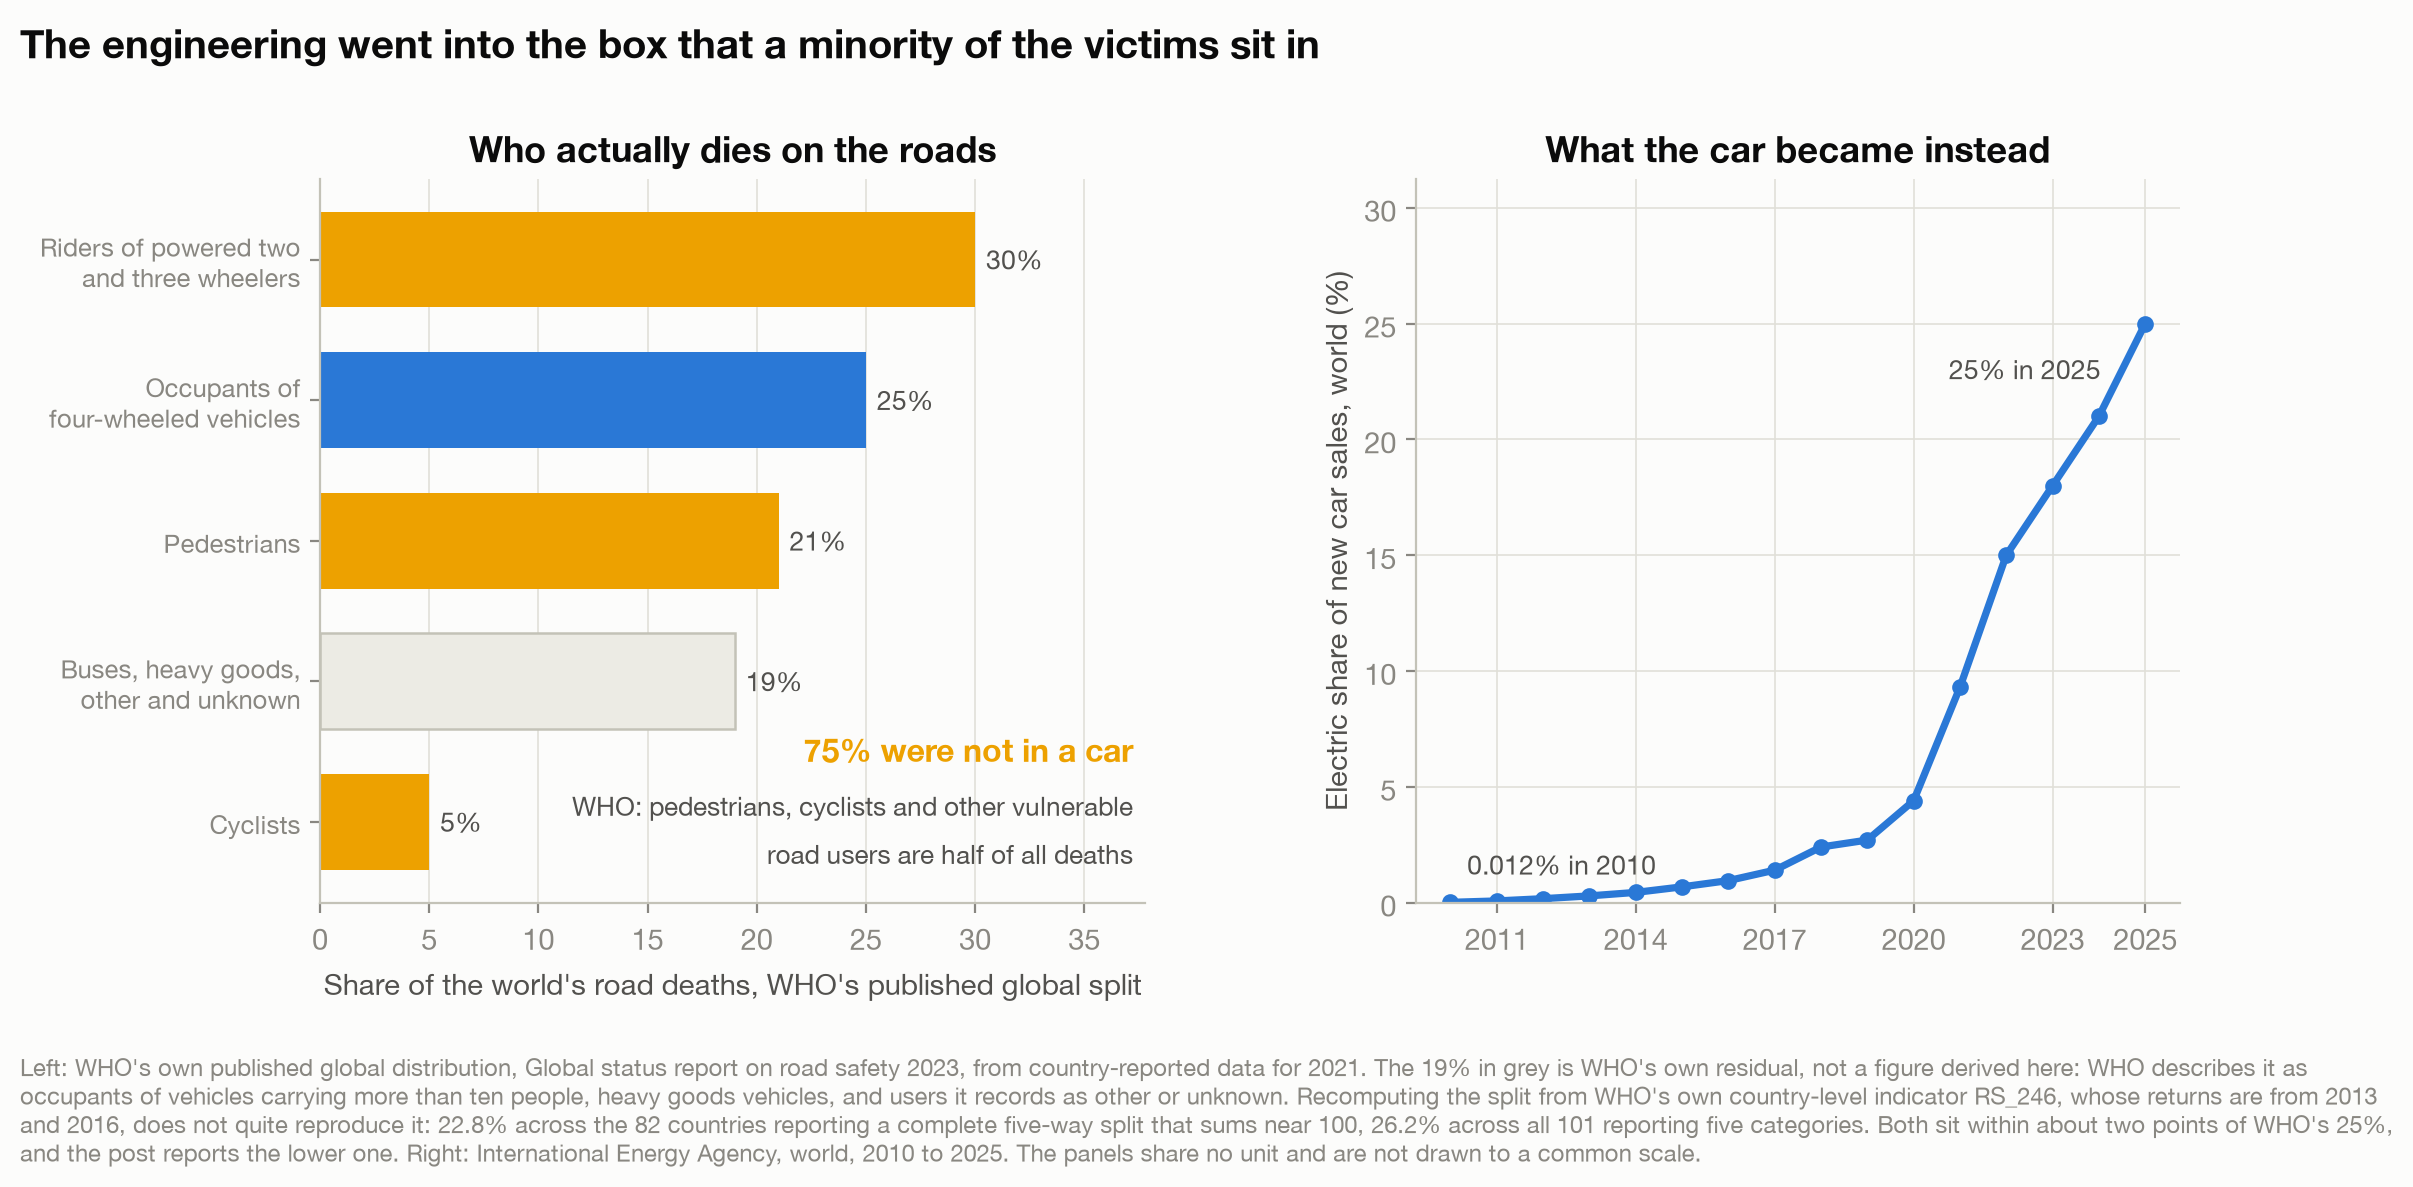
By the World Health Organization’s Global Health Estimates, 1,184,514 people were killed on the world’s roads in 2000. In 2021 the figure was 1,182,759. Two decades, almost exactly the same number of dead. Per person the risk did fall, by 23 percent, but that is the denominator: 29 percent more people alive, barely any fewer dying.
Meanwhile the car was reinvented: electric vehicles went from 0.012 percent of new car sales worldwide in 2010 to 25 percent in 2025 (International Energy Agency, 2026). Electrification aimed at emissions, not crashes, and I am not judging it against a goal it never had. The dying have a number too. What they have never had is one anyone was driving at.
Who are they? By WHO’s own count, only 25 percent of road deaths are people inside a four-wheeled vehicle. Riders of powered two and three wheelers are 30 percent, pedestrians 21, cyclists 5, and the remaining 19 percent are buses, heavy goods vehicles and users WHO records as other or unknown (World Health Organization, 2023). Pedestrians, cyclists and other vulnerable road users account for what WHO calls half of all deaths. Road traffic injury is the leading cause of death for children and young adults aged 5 to 29 (World Health Organization, 2026b).
So fifteen years of engineering went into the object three in four of the victims were never inside, though automatic braking and bonnet design do reach the people outside it. Battery chemistry, charging curves, kilowatt hours: measurable to three decimals, workable at a bench. Why a teenager on a motorbike dies on an unlit road in the low- and middle-income countries holding around 60 percent of the world’s vehicles and 92 percent of its road deaths (World Health Organization, 2026b) is neither of those things. One problem holds still. The other does not.
Where the effort should be, if effort followed the damage
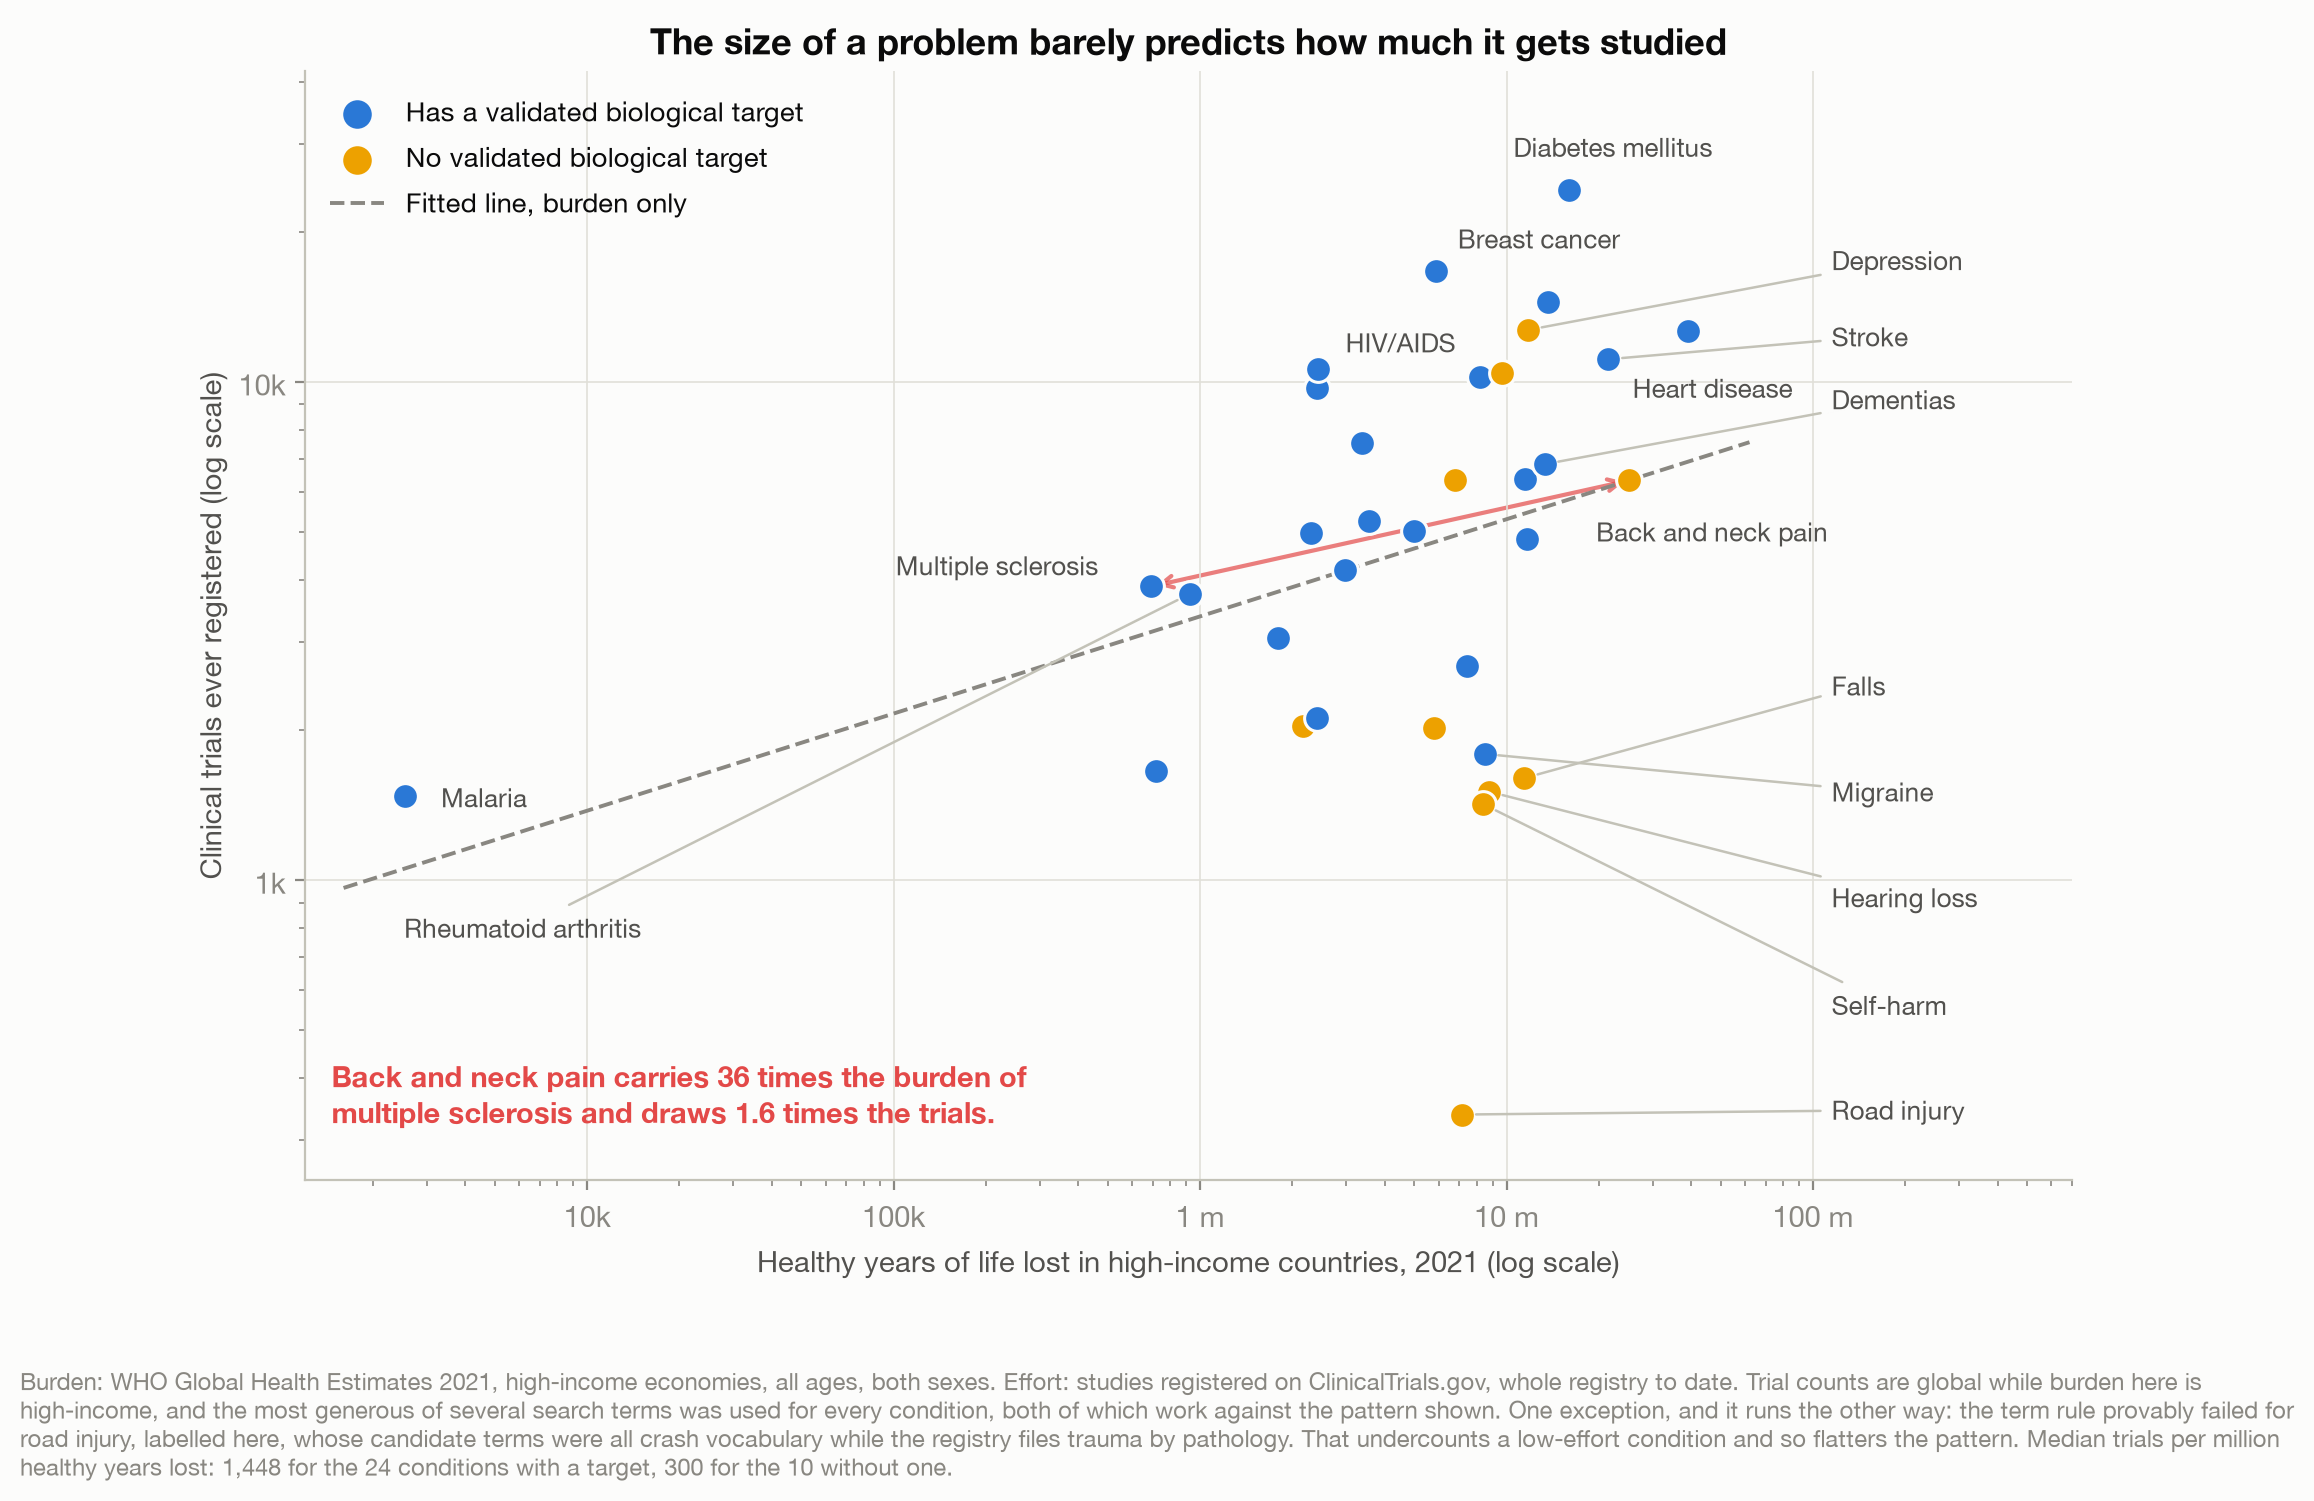
Medicine is the one domain where effort and human cost are measured in comparable units. So: 34 conditions, each one’s toll in healthy life lost across high-income countries, against clinical trials ever registered. The relationship is weak: high-income burden alone accounts for about 9 percent of the variation in trial counts. The coefficient is positive and statistically detectable, so effort does not ignore burden. It barely tracks it.
Up close: back and neck pain is the third largest single cause of lost healthy life in rich countries, behind COVID-19 and ischaemic heart disease, at 25.2 million healthy years in 2021. Multiple sclerosis costs 692,879 of them, so back pain carries 36 times the burden and draws 1.6 times the trials.
The obvious explanation is money. Rich patients, rich diseases. Except low back and neck pain was the largest of 154 conditions studied for US health care spending, 134.5 billion dollars in 2016 (Dieleman et al., 2020). It does not lack a market. It lacks a handle.
The pattern breaks the other way. Malaria destroyed 52.1 million healthy years worldwide in 2021 and 2,541 of them in high-income countries, and its rich-world market is travellers and the military. It still has 1,472 trials and drew 239.8 million dollars from the National Institutes of Health in one year.
So I tested it against a market measure carrying no judgement: the share of a condition’s global burden in high-income countries. Accounting for burden, it predicts nothing, at a t of 0.71.
That settles less than I would like. A burden share is not a market size: first-generation multiple sclerosis drugs cost about 60,000 dollars a patient-year in 2013 before rebates, 41,000 to 53,000 after (Hartung et al., 2015), while back pain’s larger total is spread across millions. So the claim is narrower than “not about money”. It is that where the paying patients live does not predict where the research goes.
What does work is duller. I coded every condition on one question: is there a validated biological target, something in the body an intervention can act on. A pathogen, a receptor, a tumour, an autoimmune process. The 24 conditions with a target draw a median 1,448 trials per million high-income healthy years lost. The 10 without one draw 300. Hold burden constant and the gap narrows to about two and a half times, but it survives: that single yes or no lifts the variation accounted for from 9 percent to 28. I should say plainly that I had seen a table of trials per unit of burden before writing the rule down. It is mechanical and checkable, but not blind, and that limits what it can bear.
At the bottom of that chart, fewest trials for the damage done: road injury, falls, self-harm, hearing loss, and migraine, which has a target and still sits there. Malaria sits far left, tiny, above the fitted line: a parasite is a thing you can point at.
The money, which is worse
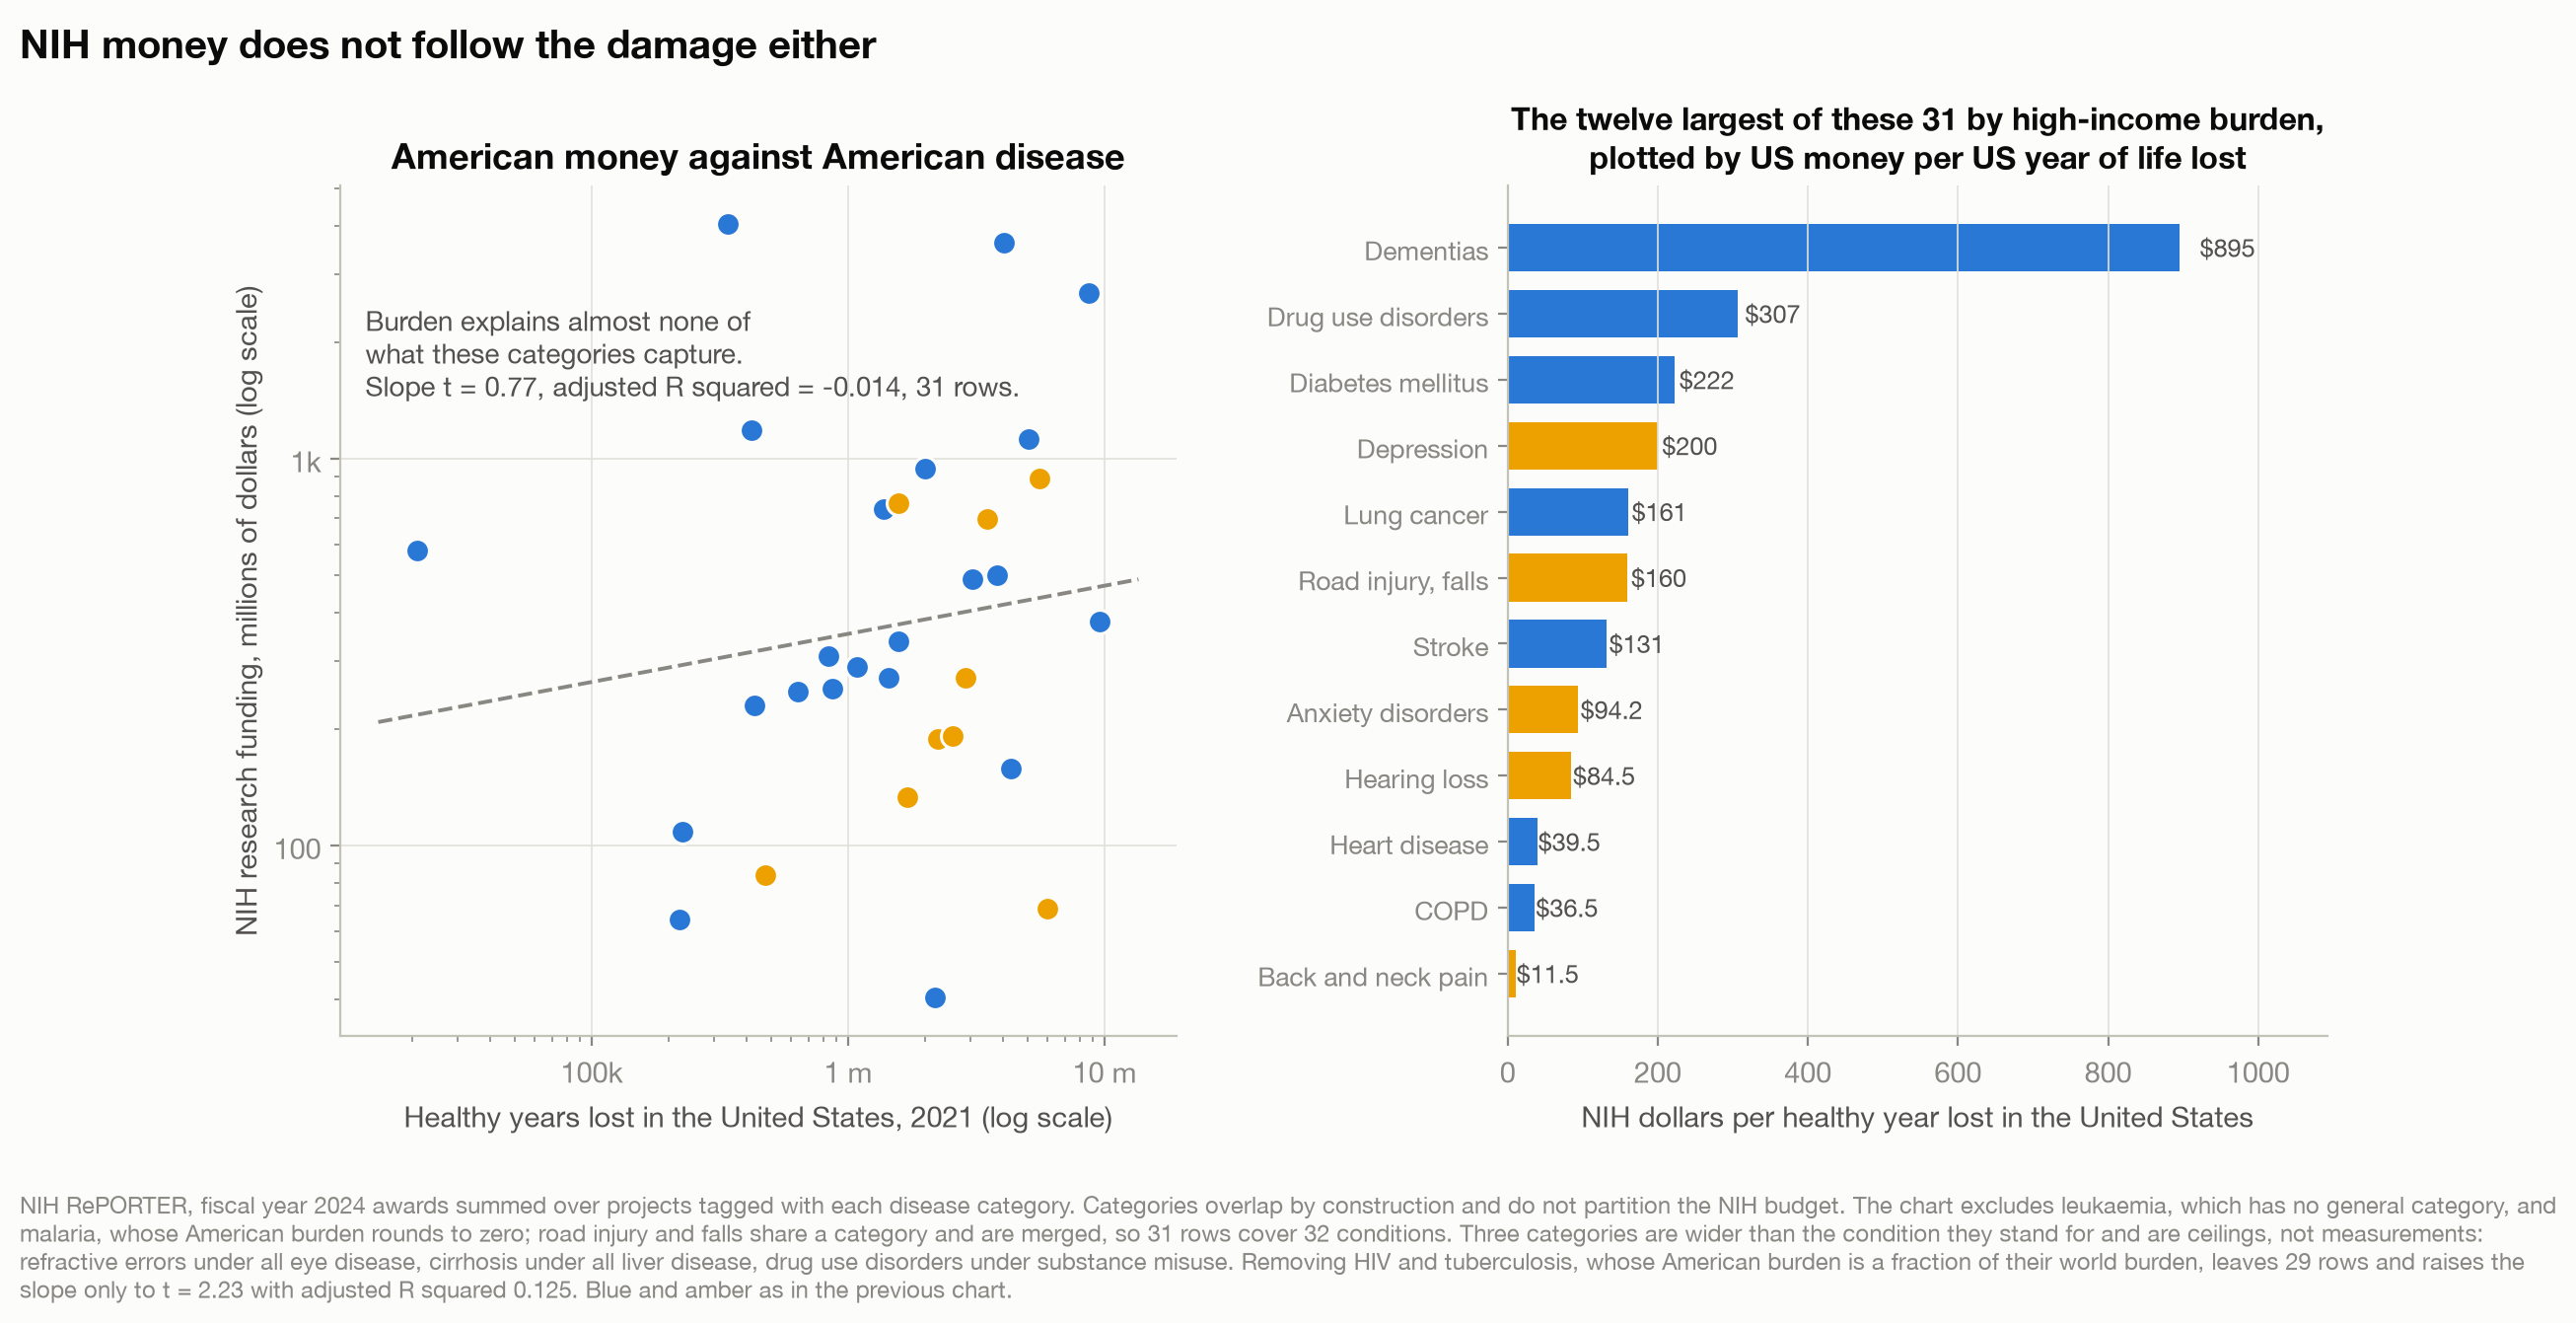
I reconstructed what the NIH spent in fiscal year 2024 on each condition from its own project records, against how much healthy life each destroys in America.
American disease burden accounts for essentially none of the NIH spending these categories capture. Across 31 rows covering 32 conditions the slope runs a t of 0.77 and the adjusted R squared is negative: a horizontal line fits as well. Remove HIV and tuberculosis, whose American burden is a fraction of their world burden, and across the remaining 29 rows it improves to a t of 2.23 and 12.5 percent: the charitable reading, still weak. Malaria is in neither, its American burden rounding to zero, which is the point. Two caveats, both mine: these rows are disease categories, not the NIH budget, and I never ran the validation I promised myself, though they are NIH’s own totals, not estimates.
Now the per-unit numbers, from the twelve rows above carrying the largest high-income burden. Dementias draw 895 dollars per healthy year lost in the United States, back and neck pain 11.5. Multiple sclerosis, not among those twelve, draws 479, about 42 times what back pain gets. Swap the narrow Back Pain category for the broader Chronic Pain one and the total rises from 68.8 million dollars to 792.6 million, or 133 per healthy year lost. It still loses.
I expected the money to echo the trials, more faintly. Run the target binary against NIH dollars and the coefficient points the same way at about three-quarters the size, but at a t of minus 1.50 the interval runs from a large gap through zero to a small one the other way. The money cannot settle it. It does say dollars do not track suffering.
Three things that did not work
First, I predicted a clean three-step gradient: a target and an objective endpoint would draw most research, one of the two less, neither least. Instead the conditions I coded least tractable sit above the middle group, 642 trials per million against 362. The reason is psychiatry. Depression has no validated biological target and no objective endpoint, and it has 12,693 registered trials. Anxiety has 10,400. Both beat back and neck pain, which carries more burden than either. A field with nothing to aim at can still run enormous trial programmes. No validated biological target is a claim about mechanism, not about whether treatments work or the suffering is real. The honest reading is not that psychiatry is special. It is that my coding may be wrong for it. Recoding depression the other way strengthens the result, so the concession costs me nothing.
Second, one of my 34 conditions is not properly measurable, and it is the most influential point. Road injury is a cause, not a condition a registry indexes. Every term I pre-registered was crash vocabulary while the registry files trauma by pathology, my 338 trials sits against 2,610 for traumatic brain injury and 4,815 for fractures. My promise to use the most generous term fails here. Drop road injury and the finding holds on the high-income basis at a t of minus 2.50, and weakens on the global basis to minus 1.71, no longer significant at the 5 percent level. On the high-income basis the two-and-a-half-times gap becomes twice; on the global basis it runs from 2.1 times to 1.7. I left it in rather than remove an inconvenient point after seeing its residual.
Third, two conditions I flagged in advance as awkward stayed awkward. Drug use disorders counts as having a target, opioid receptors being real and urine toxicology objective, yet draws few trials. Uncorrected refractive errors also counts as having one and pulls 2,812 dollars per American healthy year lost, the highest of the 29 rows once HIV and tuberculosis are set aside, because its problem is delivering spectacles, not discovering anything. That figure flatters it: the category is all of eye disease. Both cut against me. Both stay.
Now watch it happen live
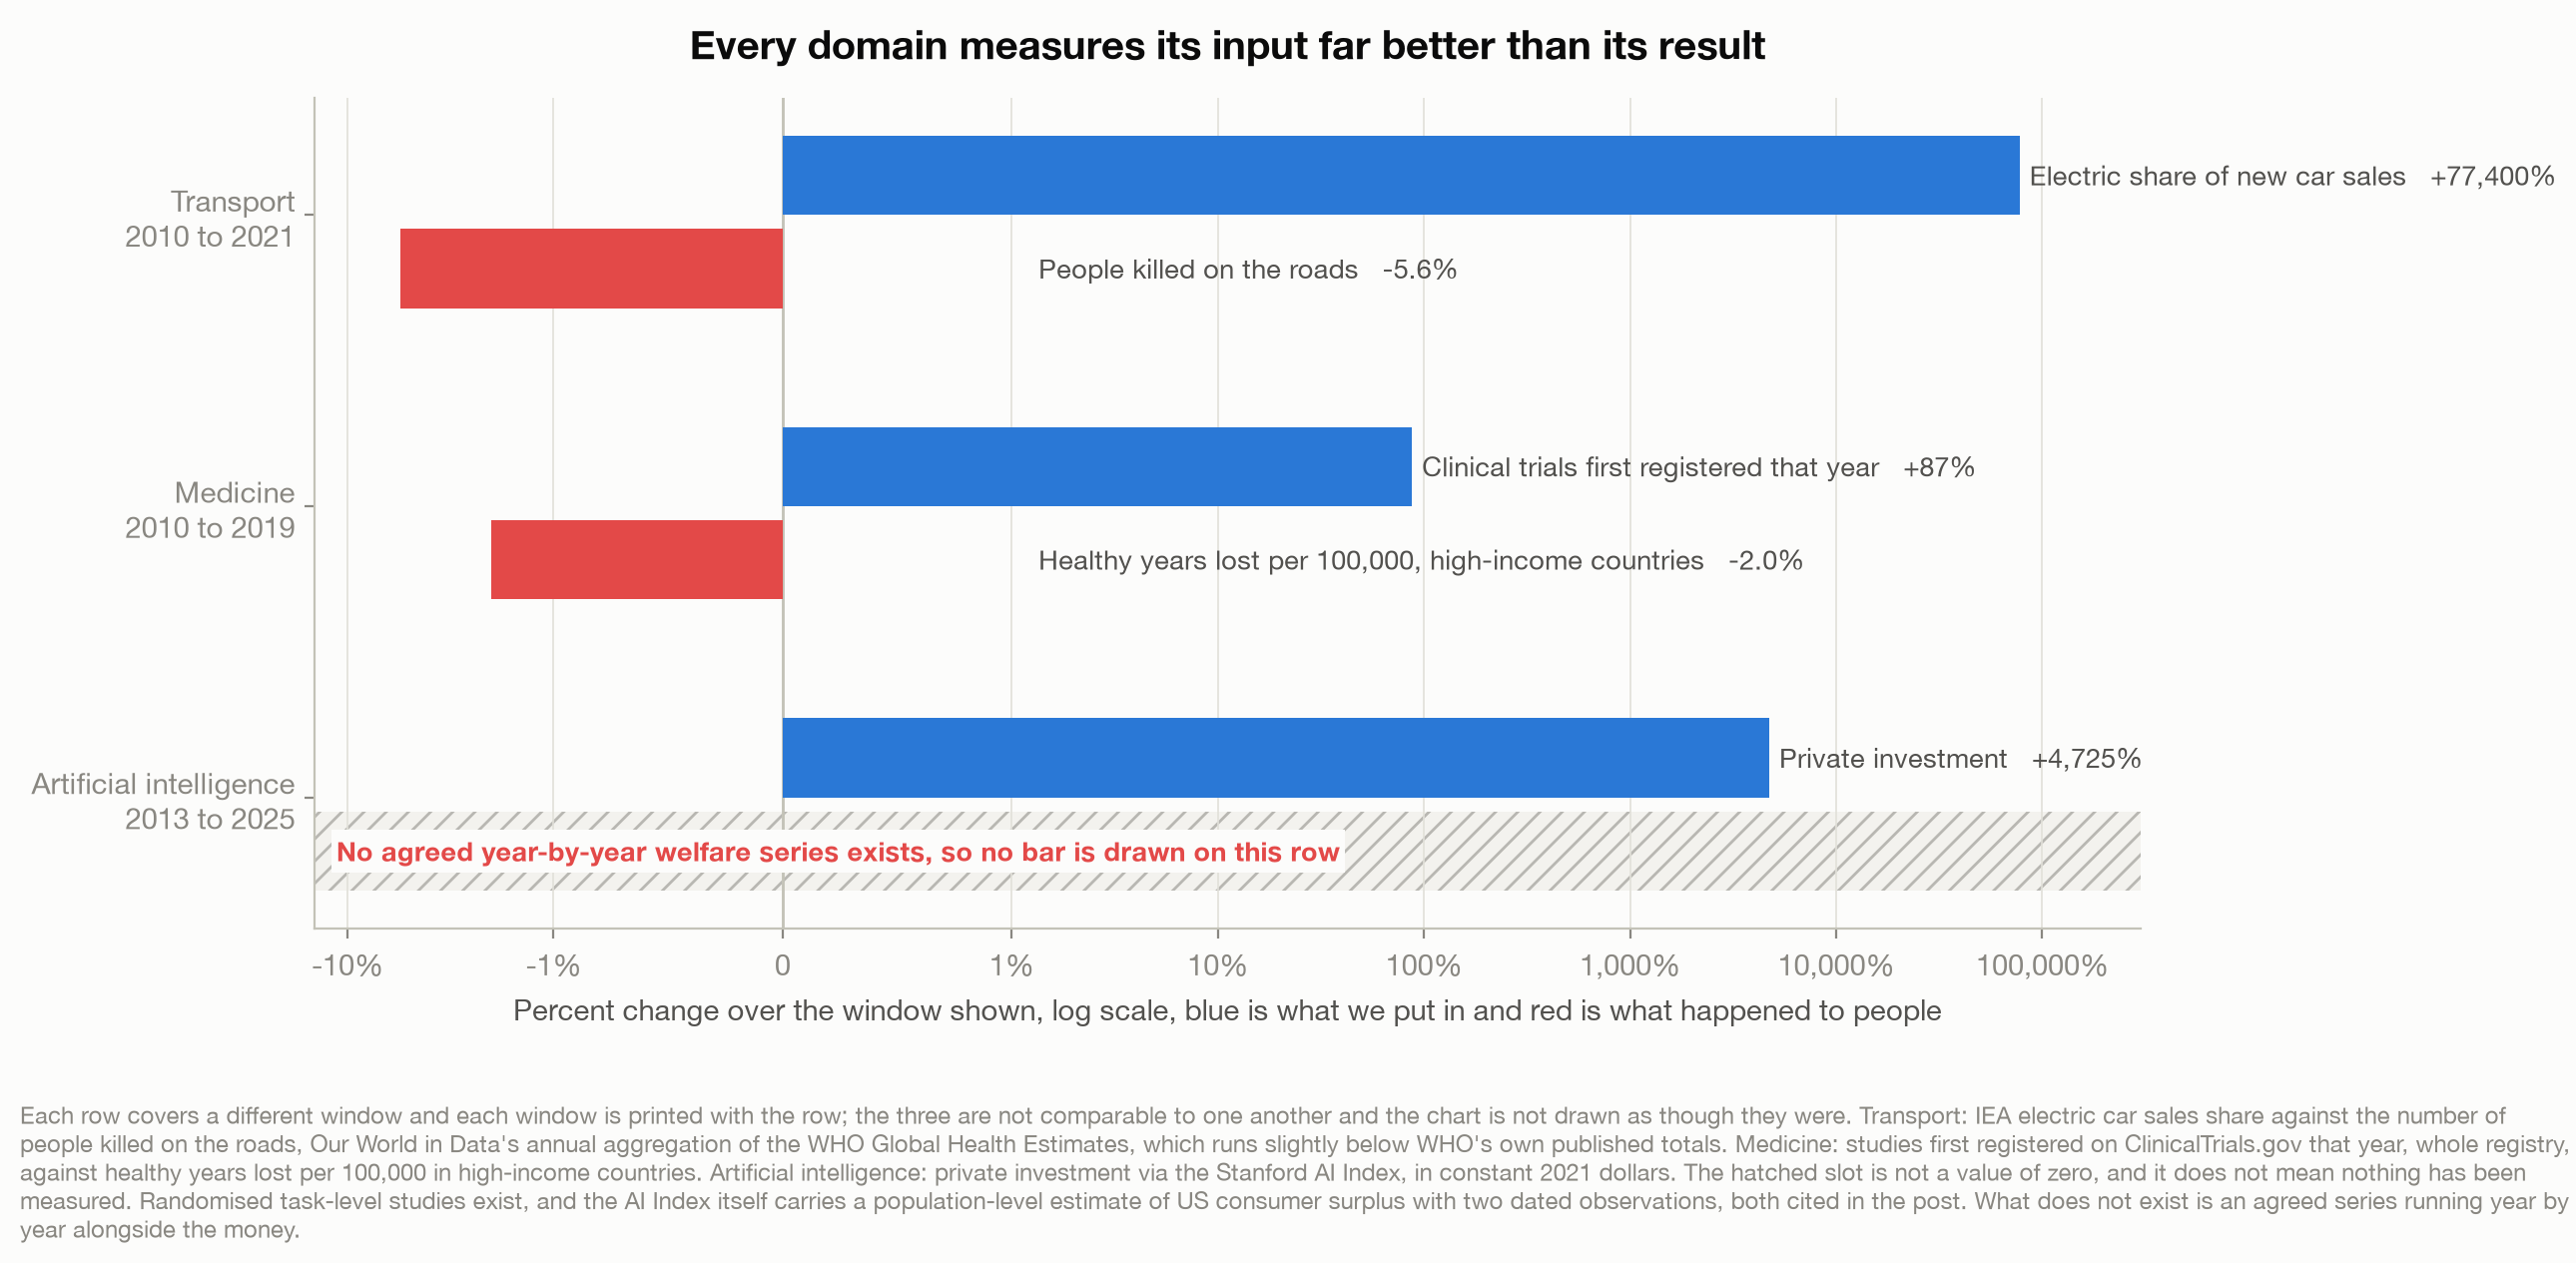
Artificial intelligence is the same story, and the only one where the second number does not exist.
The input side is measured beautifully. Private investment went from 6.01 billion dollars in 2013 to 290.1 billion in 2025, a rise of 4,725 percent in constant 2021 dollars (Quid & U.S. Bureau of Labor Statistics, 2026), and Epoch AI’s database, mirrored by Our World in Data, carries training compute for 527 systems to the petaflop.
Now the other side, where I have been wrong twice. My first draft said no measure existed of what this has done for people: Noy and Zhang (2023) measured writing productivity in a randomised experiment, Brynjolfsson et al. (2025) tracked five thousand support agents. My second draft said no population-level measure existed, and the AI Index, the source of the investment line above, carries one: US consumer surplus from generative AI at 172 billion dollars by March 2026 against 116 billion eight months earlier, from two survey waves (Brynjolfsson et al., 2026).
So what is missing is not measurement. It is an agreed series: thirteen years of money published annually by everyone, against two survey waves in one country, first reported this year. That is why the bottom row of the last chart carries no bar.
What this does and does not prove
It does not prove research money is wasted or anyone is acting badly. Every decision here is defensible: you fund the study you can design and work where you can tell if you are getting anywhere. Nor is tractability the only thing going on. But the two comparisons I would defend hardest do not depend on my coding: back and neck pain against multiple sclerosis, and malaria against a market that barely exists.
What survives is narrower than the question I started with. Research effort tracks the size of a human problem only weakly, does not track where the paying patients live, and tracks best whether it has a handle on it. So: for us, or for the paying patients? Neither. It goes to whatever holds still long enough to be worked on, and the things that hold still are not the things that hurt most.
That changes the remedy. If the filter were greed you could legislate: tax, mandate, prize, cap. We know how to argue with an incentive.
A difficulty filter has nobody to argue with. Nobody chose it, so nobody can be made to un-choose it, and it yields only to somebody deciding to spend years and money on work that will show nothing for a long time. That last part is an inference, not a finding: nothing here tests what makes a difficulty filter yield. But it is the only thing I can see that moves a problem out of the column marked too hard.
Method notes
What is being counted. Burden is DALYs, healthy years of life lost, from the World Health Organization’s Global Health Estimates 2021 (World Health Organization, 2024). Research effort is the count of studies registered on ClinicalTrials.gov, whole registry to date, retrieved 10 August 2026 (National Library of Medicine, 2026). Research money is NIH award amounts for fiscal year 2024, summed over projects tagged with each disease category through the RePORTER API, retrieved the same day (National Institutes of Health, 2026). The road death counts are from WHO’s own Global Health Estimates deaths tables, cause code 1530, and the per-person comparison divides them by the same release’s own world population rows, giving 19.1 deaths per 100,000 in 2000 against 14.8 in 2021; WHO’s separately published indicator RS_198 puts 2021 at 15.0 (World Health Organization, 2026a). The road user split is WHO’s own published global distribution from the Global status report on road safety 2023 (World Health Organization, 2023). AI training compute is Epoch AI’s series (Epoch AI, 2026). Three WHO products give three totals for roughly the same quantity: the Global Health Estimates put 2021 at 1,182,759, the road safety report says 1.19 million for the same year, and the 2026 fact sheet says approximately 1.16 million without naming a year, which WHO’s news release of the same date attributes to 2025. Different vintages, methods and years, and not interchangeable. This post uses the Global Health Estimates throughout, because that is where every disease figure here also comes from.
Three burden bases, and which one every figure uses. Trial counts are global. They are compared against high-income burden, because that is where the market question can be asked, and against global burden as a check. NIH dollars are American and are compared against American burden. Every figure in this post that involves burden names its basis in the sentence. On the global basis the target effect is much weaker: it accounts for 10 percent of the variation rather than 28, with the coefficient on having no validated target at a t of minus 2.26, and as noted above it does not survive dropping road injury.
The search terms. Each condition was searched under several ClinicalTrials.gov terms and the term returning the most studies was used. Back and neck pain scores 6,334 under “back pain OR neck pain” and 1,826 under “chronic low back pain”. Road injury is the documented failure of that rule, described above. Every alternate and its count is in the repository.
One pre-registered falsification condition fired. I wrote three in advance. The first, that a market measure would beat tractability, did not fire. The second, that the gap would vanish under the most generous search terms, did not fire, though the road injury case shows that rule can fail. The third did fire: the class ordering is not the same on the two measures. By trials it runs tractable, intractable, partly; by dollars it runs tractable, partly, intractable. Which means the three-step gradient I say I abandoned is the order the dollars actually produce, and I should say so; I abandon it because it fails on trials, the measure this argument rests on. On dollars the gradient is real and five sixths of it is the first step: a median 300 dollars per American healthy year lost for the tractable conditions, 160 for the partly, 135 for the intractable. Two caveats on those three numbers. The middle one is a single row, road injury and falls merged, out of a class of seven. And the first is taken over rows that still include HIV and tuberculosis, which the money regression two sections above removes; on those 29 rows it is 280. The binary the post does rest on points the same way on both measures, though on dollars the regression cannot separate it from zero.
What the money analysis cannot see, and the promises I broke. These 31 rows are disease categories, not the NIH budget. A great deal of what the NIH funds is basic science indexed to no disease at all, and nothing here measures what share of the agency’s spending these categories cover. Two commitments in my design document went unkept. I promised to validate the reconstruction against NIH’s own published category totals and never ran it, and I never even downloaded the published figures, so the check was not run and could not have been. I also promised a date-windowed trial count as a guard against registry growth, and never computed one.
The coding judgement most worth disputing. Road injury and falls are coded as having no validated biological target. A reader who counts a crash as an identified causal agent, which is the second limb of my own rule, would code them the other way. The pre-registration forbids recoding a condition after seeing its residual, so I have not: instead, here is what it would cost. Recoding both takes the target effect from a t of minus 3.05 to minus 1.06, and the variation accounted for from 28 percent to 10. That is the largest single change anyone can make to this result, and it is larger than anything else in this section.
Categories overlap, and three are broader than the condition. NIH research categories are not a partition of the budget: one project can be tagged to many and they do not sum to the total. Leukaemia is excluded because no general category exists for it, and road injury and falls are merged into one row because they share a category, with their burden summed so that neither is credited with the other’s money. Three conditions carry a category wider than themselves and their dollars-per-year figures should be read as ceilings: refractive errors sits under all eye disease, cirrhosis under all liver disease, and drug use disorders under substance misuse, which includes alcohol and tobacco.
What the road user split rests on, and the numbers I nearly published. WHO’s three broken-out vulnerable categories come to 56 percent, so “half of all deaths” is WHO’s own conservative phrasing rather than a fourth figure. The split above is WHO’s own, from the road safety report, and it is country-reported data for 2021 rather than the modelled total the death count comes from. WHO breaks out four categories covering 81 percent of deaths and publishes the remaining 19 percent itself, as occupants of vehicles carrying more than ten people, heavy goods vehicles, and users it records as other or unknown.
I got here the hard way, twice. First I computed the split myself from WHO’s country-level indicator RS_246 and got 22.8 percent for four-wheeled occupants, which an earlier draft printed in bold. That figure rests on 82 countries holding 37 percent of the world’s road deaths, because a country is only usable if it returns all five categories and they sum near 100: 139 countries report something, 101 report all five, and the sum tolerance drops 19 more, the United States among them. Then, correcting that, I took WHO’s published figure from the organisation’s launch news release rather than from the report. The release contradicts the report it announces. It puts four-wheeled occupants at 30 percent, which is the report’s figure for motorcyclists, and prints a 3 percent share for e-scooters and the like that the report says does not exist globally. My own recomputation ran in the direction that suited my argument, which is the exact failure the rest of this post is about. The press release ran the other way, which is how I noticed that neither of them was the report. The report is 25 percent, my recomputation 22.8, and the gap between them is sample coverage.
Two aggregations of the same estimates, and which figure comes from which. WHO publishes the Global Health Estimates for 2000, 2010, 2015, 2019, 2020 and 2021, not as an annual series. The two numbers this post opens on are WHO’s own. Anything year by year, including the last chart’s transport row and the shape described here, is Our World in Data’s aggregation of the same estimates, which runs about 7,000 to 9,000 deaths a year below WHO’s own totals and is used for shape rather than level. On that series the count peaked in 2012 and the 2020 figure is a pandemic year that says nothing about road safety. The last chart’s three windows also differ and each row prints its own; transport there runs 2010 to 2021, where the electric share went from 0.012 to 9.3 percent.
AI investment figures are Our World in Data’s inflation-adjusted series in constant 2021 dollars, compiled from Quid via the Stanford AI Index and deflated using the US Consumer Price Index. The series covers external investment deals and does not capture internal corporate research and development, so it understates total spending.
References
Brynjolfsson, E., Collis, A., Eggers, F., Kazinnik, S., & Nguyen, D. (2026). What is generative AI worth? Stanford Digital Economy Lab. https://digitaleconomy.stanford.edu/app/uploads/2026/04/WhatsGenAIWorth.pdf
Brynjolfsson, E., Li, D., & Raymond, L. (2025). Generative AI at work. The Quarterly Journal of Economics, 140(2), 889-942. https://doi.org/10.1093/qje/qjae044
Dieleman, J. L., Cao, J., Chapin, A., Chen, C., Li, Z., Liu, A., Horst, C., Kaldjian, A., Matyasz, T., Scott, K. W., Bui, A. L., Campbell, M., Duber, H. C., Dunn, A. C., Flaxman, A. D., Fitzmaurice, C., Naghavi, M., Sadat, N., Shieh, P., … Murray, C. J. L. (2020). US health care spending by payer and health condition, 1996-2016. JAMA, 323(9), 863-884. https://doi.org/10.1001/jama.2020.0734
Epoch AI. (2026). Parameter, compute and data trends in machine learning [Data set]. With major processing by Our World in Data. Retrieved August 10, 2026, from https://ourworldindata.org/grapher/computation-used-to-train-notable-artificial-intelligence-systems
Hartung, D. M., Bourdette, D. N., Ahmed, S. M., & Whitham, R. H. (2015). The cost of multiple sclerosis drugs in the US and the pharmaceutical industry: Too big to fail? Neurology, 84(21), 2185-2192. https://doi.org/10.1212/WNL.0000000000001608
International Energy Agency. (2026). Global EV outlook 2026 [Data set]. Processed by Our World in Data. Retrieved August 10, 2026, from https://ourworldindata.org/grapher/electric-car-sales-share
National Institutes of Health. (2026). RePORTER API version 2 [Data set]. U.S. Department of Health and Human Services. Retrieved August 10, 2026, from https://api.reporter.nih.gov/
National Library of Medicine. (2026). ClinicalTrials.gov API version 2 [Data set]. U.S. National Institutes of Health. Retrieved August 10, 2026, from https://clinicaltrials.gov/data-api/api
Noy, S., & Zhang, W. (2023). Experimental evidence on the productivity effects of generative artificial intelligence. Science, 381(6654), 187-192. https://doi.org/10.1126/science.adh2586
Quid, & U.S. Bureau of Labor Statistics. (2026). External funding for privately held AI companies raising above $1.5 million [Data set]. Via the Stanford Institute for Human-Centered Artificial Intelligence AI Index report, with major processing by Our World in Data. Retrieved August 10, 2026, from https://ourworldindata.org/grapher/private-investment-in-artificial-intelligence
World Health Organization. (2023). Global status report on road safety 2023. https://www.who.int/publications/i/item/9789240086517
World Health Organization. (2024). Global Health Estimates 2021: Disease burden by cause, age, sex, by country and by region, 2000-2021 [Data set]. https://www.who.int/data/gho/data/themes/mortality-and-global-health-estimates/global-health-estimates-leading-causes-of-dalys
World Health Organization. (2026a). Global Health Observatory data repository: Indicators RS_196, RS_198 and RS_246 [Data set]. Retrieved August 10, 2026, from https://ghoapi.azureedge.net/api/
World Health Organization. (2026b, July 20). Road traffic injuries [Fact sheet]. https://www.who.int/news-room/fact-sheets/detail/road-traffic-injuries
// About the author
Jonathan Chrisnaldy is a product manager and analyst in New York City, with an M.S. in Technology Management from Columbia University. He writes data stories about the numbers behind everyday claims. More on the experience page or LinkedIn.