· 17 min read · Jonathan Chrisnaldy
The Easiest Promise to Keep Is the One You Can Count
Indonesia put an education spending share into its constitution, went to court to enforce it, and has met it every year since 2009. The money was budgeted exactly as promised. The reading was not. A percentage is a promise about an input, and it can be kept in full while the thing it was meant to buy stays out of reach.
Picture a ten-year-old in a classroom somewhere in Indonesia, holding a short passage in her own language. She can say the words. She cannot tell you what the paragraph means. She is not unusual. On the most recent available measurement, which uses assessment data from 2015 and so predates the pandemic, the World Bank put the share of Indonesian children at late primary age who cannot read and understand a simple text at 53%, about 18 percentage points worse than the East Asia and Pacific average (World Bank, 2024).
Here is what makes her worth thinking about. The school she is sitting in exists because of a promise her country wrote into its own constitution, and then kept. The money is not missing. Nationally, it was allocated, on time, in the amount specified, every year of her life.
This is a look at what that promise could and could not buy. It is a description of a mechanism, not an argument for or against any government or programme.
A promise the courts had to enforce
In August 2002, the Fourth Amendment to Indonesia’s 1945 Constitution added a sentence to Article 31. The state, it says, shall prioritise education at sekurang-kurangnya dua puluh persen, at least twenty percent, of the national budget and of every regional budget (Majelis Permusyawaratan Rakyat Republik Indonesia, 2002). Very few countries put a number like that beyond the reach of ordinary politics.
Writing it down was not the same as doing it. For years the budgets came in below the line, and the Constitutional Court kept being asked about it. In May 2007 the Court held that the 2007 budget’s education ceiling of 11.8%, some Rp54.1 trillion, was unconstitutional, noting that no budget from 2004 to 2007 had ever reached twenty percent (Mahkamah Konstitusi Republik Indonesia, 2007). In August 2008 it went further and struck down the entire revised budget law for that year, which had allocated 15.6%, finding what it called kesengajaan, a deliberate decision by lawmakers to breach the constitution, though it let the law stand until the 2009 budget replaced it, and instructing them to comply in the 2009 budget at the latest (Mahkamah Konstitusi Republik Indonesia, 2008).
They complied. The Ministry of Finance dates full compliance from 2009, and the mandate has been met at the national level every year since (Kementerian Keuangan Republik Indonesia, 2024).
Two things about how that was achieved are worth noticing. Part of it was definitional: the implementing law had originally set the twenty percent on education funds other than educator salaries (Mahkamah Konstitusi Republik Indonesia, 2007). The Constitutional Court later held that educator salaries count inside the education budget. That mechanically raises the measured share, since spending on educators alone is more than a third of it in the 2026 budget (Sekretariat Negara Republik Indonesia, 2025). And the constitution binds regional budgets too, where compliance is materially worse: the World Bank found 22% of districts and cities, and 35% of provinces, not meeting the same rule (World Bank, 2020).
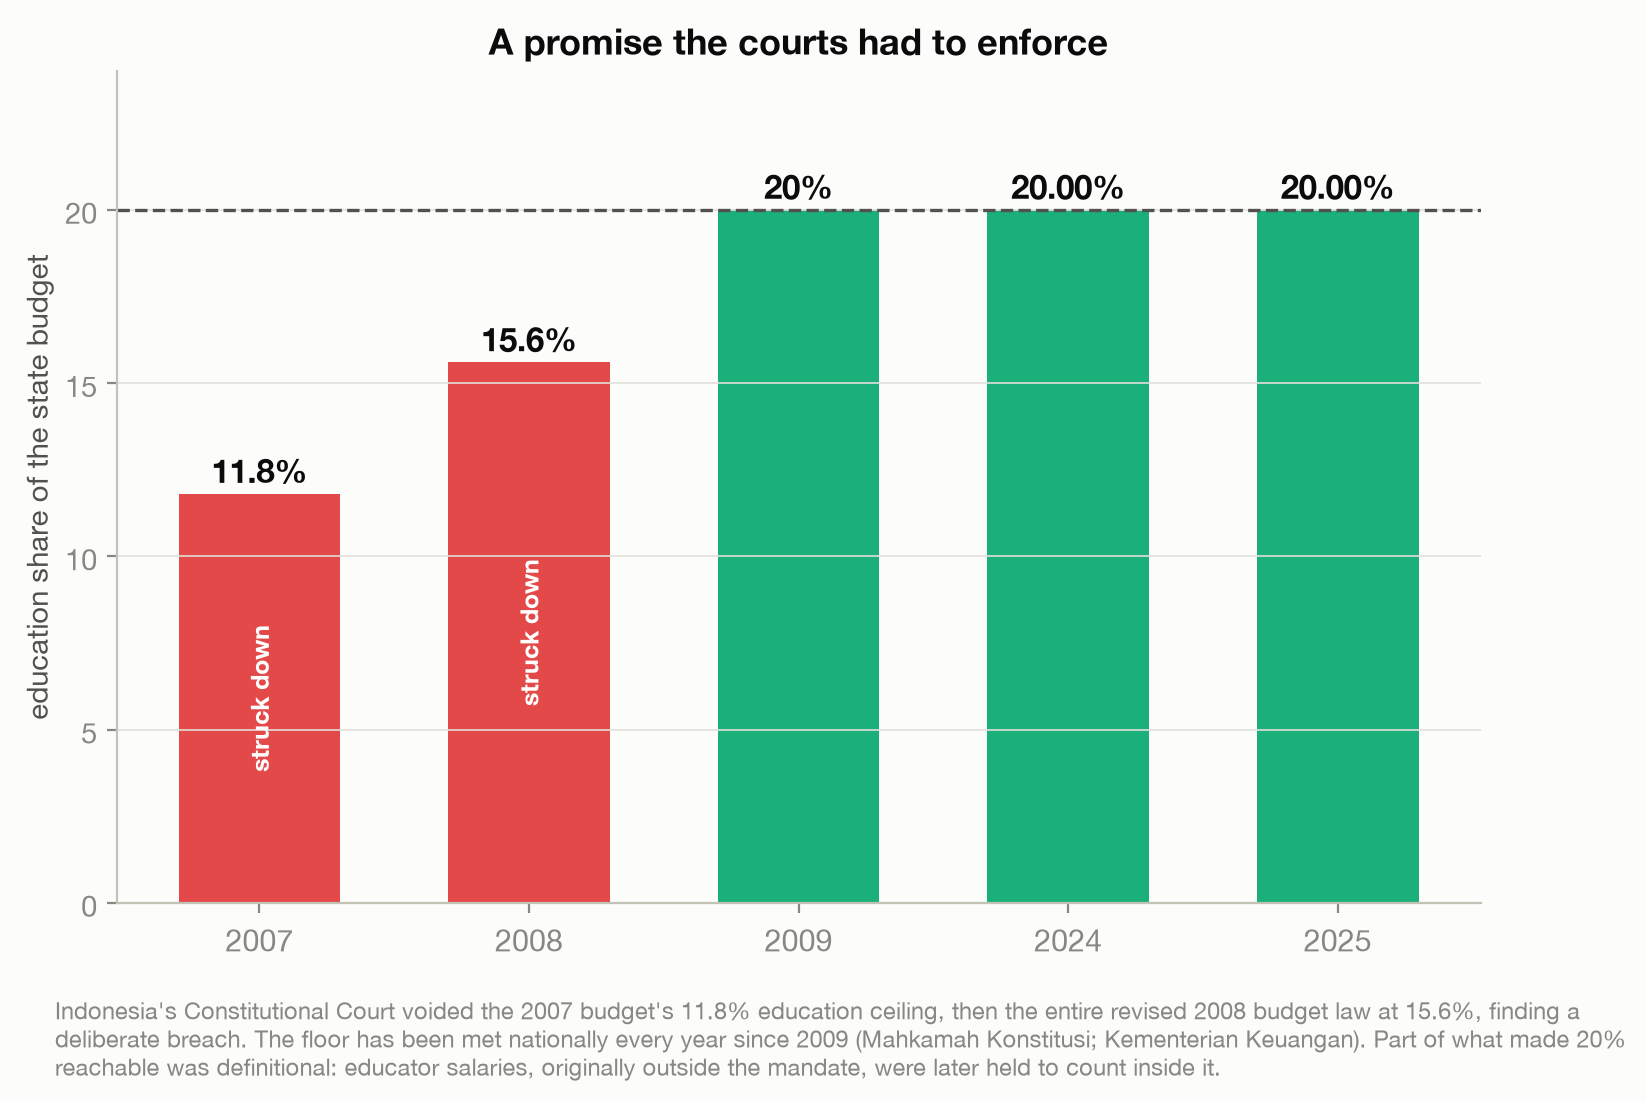
In 2024 the education allocation was Rp665.0 trillion out of Rp3,325.1 trillion in state spending. That is 20.00%. In 2025 it was Rp724.3 trillion of Rp3,621.3 trillion, again 20.00%. The target is being hit on the nose.
Even that ratio flatters, because the numerator and the denominator are not the same kind of thing. The education budget includes a financing component (pembiayaan, the education endowment fund) worth Rp77.0 trillion in 2024 and Rp80.0 trillion in 2025, which is not state expenditure at all (Kementerian Keuangan Republik Indonesia, 2023, 2024). Count expenditure against expenditure and education is about 17.7% of the budget in 2024 and 17.8% in 2025, not 20.0%.
Twenty percent of what
And this is where the first surprise sits. Twenty percent is a share, and a share is only as large as the thing it is a share of.
Indonesia’s entire state budget is small relative to the size of its economy. In 2024, total state spending came to 15.0% of GDP. Twenty percent of that is 3.00% of GDP (Kementerian Keuangan Republik Indonesia, 2023; World Bank, 2026). The constitutionally protected, court enforced commitment resolves to three cents in every hundred rupiah the country produces.
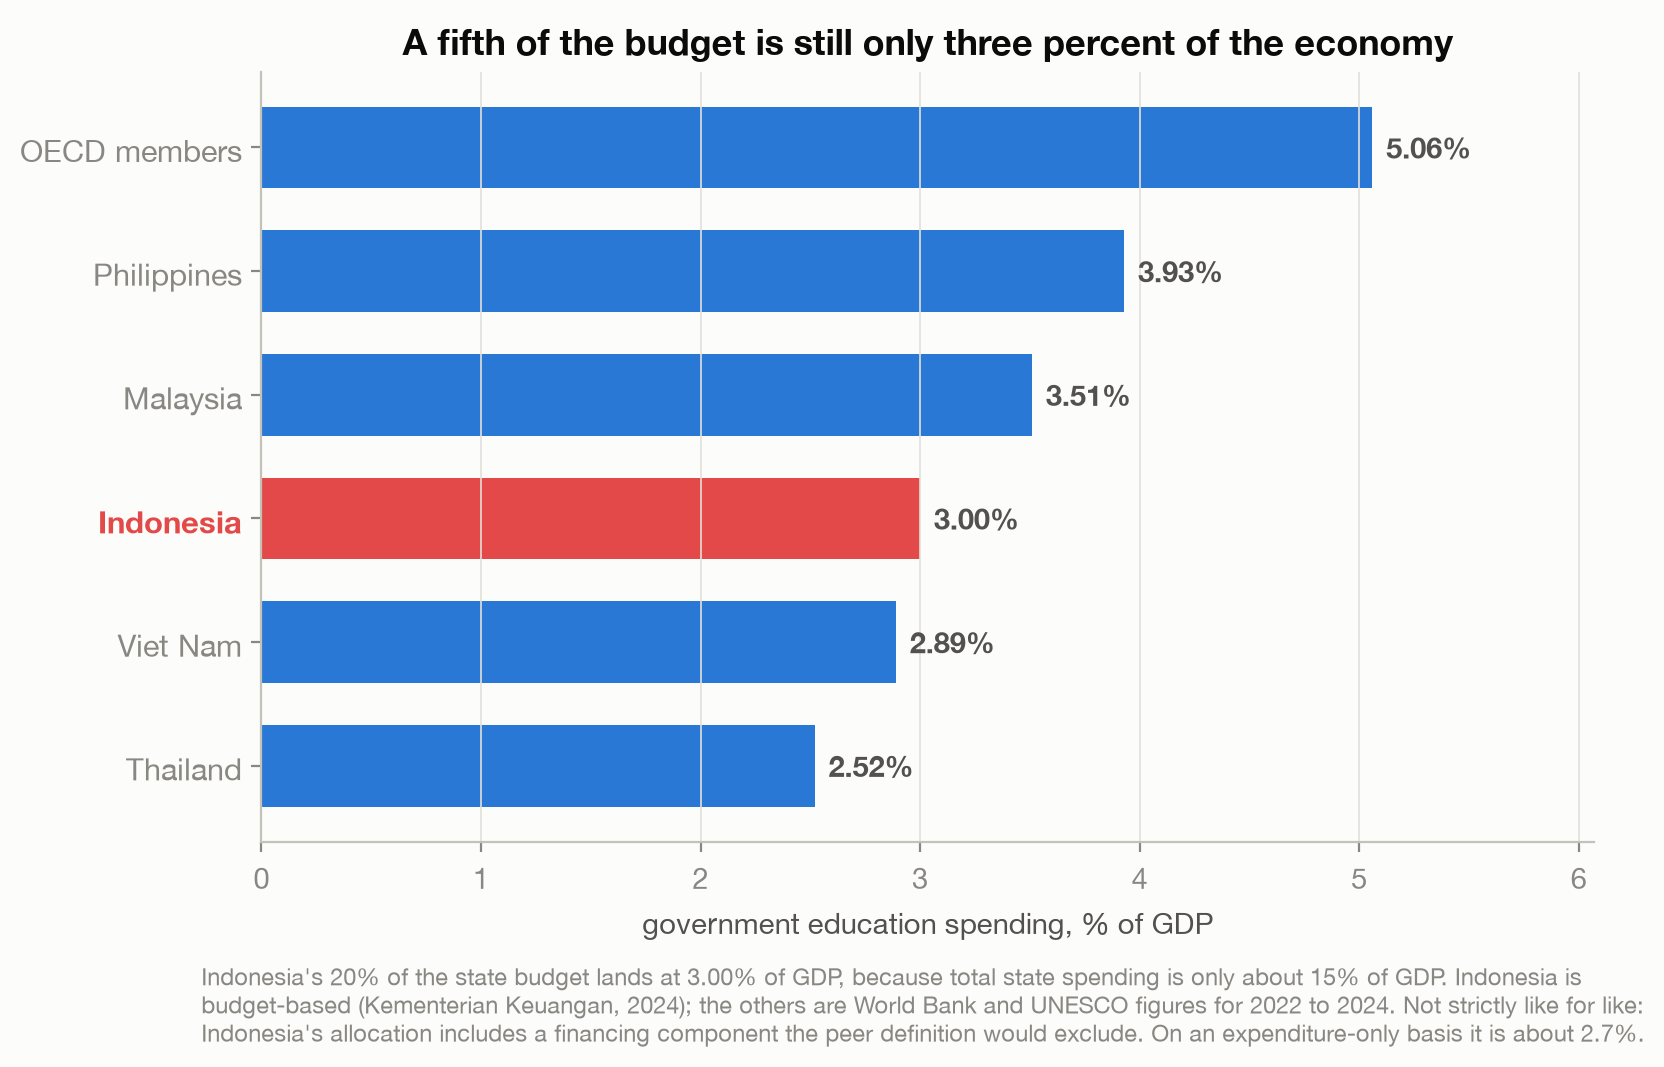
That puts Indonesia below Malaysia and the Philippines, though above Viet Nam and Thailand, and a long way below the OECD average of about 5% of GDP. On the narrower expenditure basis it is nearer 2.7%, which would move it below Viet Nam too, leaving only Thailand beneath it. The reason is not that education was shortchanged inside the budget. It is that the budget itself is thin, because the tax base is thin. Indonesia collects about 12.0% of GDP in tax, against an Asia and Pacific average of 19.5% and an OECD average of 33.9%, and that figure has barely moved in sixteen years, from 12.2% in 2007 (OECD, 2025).
A percentage of a small number is a small number. The rule guaranteed a slice, and said nothing at all about the size of the pie.
What the money did buy
It would be wrong, and lazy, to say the money achieved nothing. It bought something enormous, and the something has a name: access.
In 2001, about 40% of Indonesian teenagers were enrolled in upper secondary education. By 2018 that was 81.5%. Lower secondary net enrolment went from 73.7% in 2001 to 85.0% in 2018. Adult literacy rose from 90.4% in 2004 to 96.0% in 2020, and mean years of schooling went from 7.6 in 2006 to 8.6 in 2020 (UNESCO Institute for Statistics, 2026; World Bank, 2026).
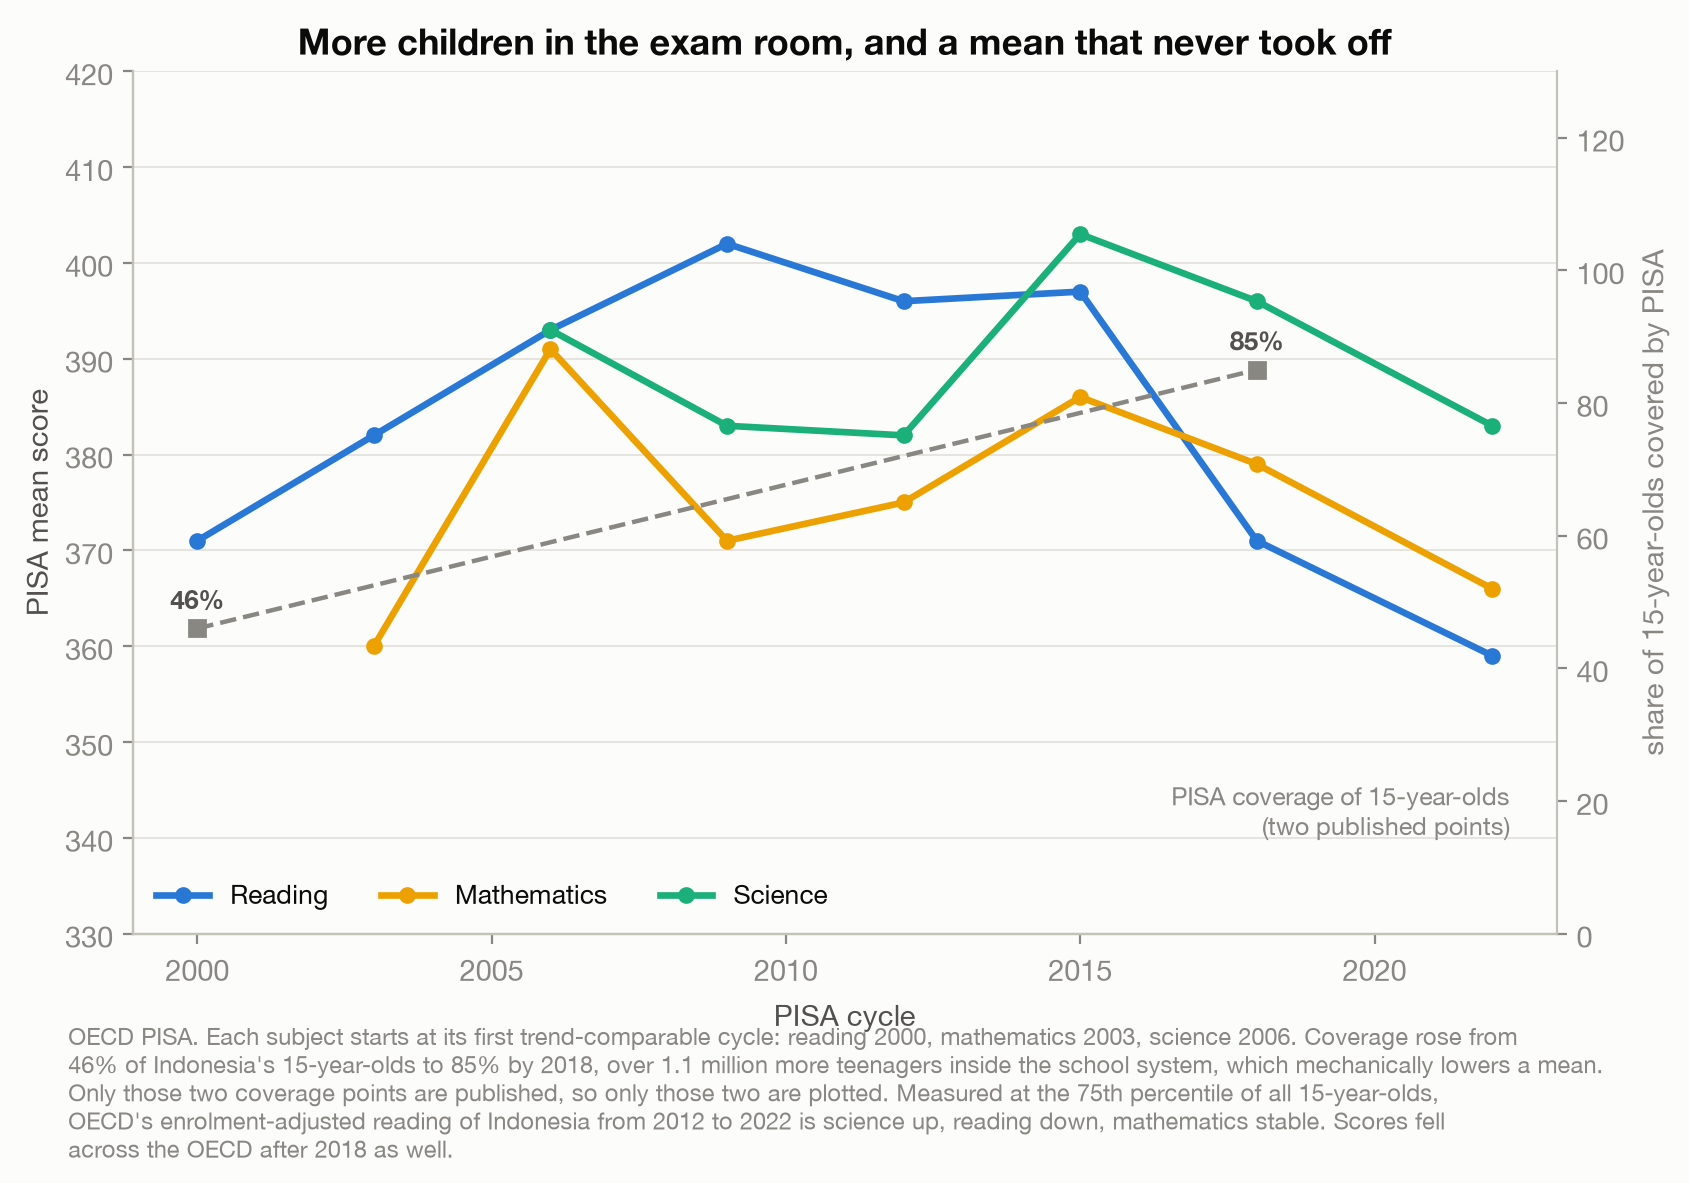
A generation that would previously have left school stayed in it. When the OECD first tested Indonesian fifteen-year-olds, its sample could reach only 46% of that age group, because the rest were not in a school year PISA could sample. By 2018 it covered 85% (OECD, 2019). Between 2012 and 2022 alone, more than 1.1 million additional fifteen-year-olds entered the part of the school system PISA can see (OECD, 2023a).
That is what a guaranteed budget line is good at. Buildings, salaries, places, seats. Things you can count, procured with money you can count.
And what it did not
The learning is the harder story, and it has to be told carefully, because the obvious version of it is wrong.
In PISA 2022, Indonesian fifteen-year-olds averaged 366 in mathematics, 359 in reading and 383 in science, against OECD averages of 472, 476 and 485. The OECD’s own summary is that Indonesia’s 2022 results are among the lowest it has ever measured, on a par with those observed in 2003 in reading and mathematics and in 2006 in science. It is describing the level, not identical scores: on the published means, 2022 reading of 359 is the lowest in Indonesia’s series, below both the 2009 peak of 402 and the first comparable reading cycle in 2000. In 2022, 18% of Indonesian students reached the baseline level of proficiency in mathematics, against an OECD average of 69%, and 25% did so in reading (OECD, 2023b).
Now the two caveats, because without them this chart says something untrue.
The first is that scores fell almost everywhere after 2018. Across the OECD, reading dropped about 10 points and mathematics nearly 15. The OECD is careful to say this decline is only partly attributable to the pandemic, and found no clear relationship between the length of school closures and the size of the fall (OECD, 2023c).
The second matters more, and it cuts against the easy narrative. When a school system rapidly absorbs the children who were previously outside it, and those children are on average poorer and less prepared, the average score goes down even if no individual child learns less. That is arithmetic, not decline. The OECD names Indonesia among the countries that expanded access fastest (OECD, 2023c), and finds that in four of those seven countries scores improved or held steady once that intake is accounted for (OECD, 2023a). Its own adjusted reading of Indonesia between 2012 and 2022, measured at the 75th percentile of all fifteen-year-olds rather than at the mean, is science up, reading down, and mathematics stable (OECD, 2023a).
Composition is not a complete answer either. That adjustment is an estimate at one point in the distribution, not a recalculated average, and scores fell across the OECD over the same period. The honest position is that the raw mean overstates whatever decline occurred, and that no one can cleanly separate how much of the rest belongs to expansion, to the pandemic, or to what happens in classrooms.
So the honest statement is not that Indonesia spent more and learned less. It is that Indonesia bought a great deal of schooling and very little measurable improvement in what happens inside it, and that the flat line is doing more work than it looks like it is.
Where the money goes
Two things help explain the gap, and neither is that money is useless.
The first is that Indonesia never reached the amount where money stops being the constraint. Among countries spending below roughly USD 75,000 cumulatively per student between the ages of six and fifteen, the OECD finds that higher spending is associated with higher mathematics scores; above that level it does not find the same association. Indonesia’s cumulative figure is about USD 19,700 (OECD, 2023b). It is nowhere near the point of diminishing returns. It is a country whose constitution guarantees a share, in a budget too small for that share to become a sufficient sum.
The second is what the share is spent on. In the 2026 draft budget, Rp274.7 trillion of the Rp757.8 trillion education allocation, or 36.2%, went to educators’ pay, including Rp69 trillion in professional allowances for 1.6 million regional civil servant teachers (Sekretariat Negara Republik Indonesia, 2025). Paying teachers properly is a defensible thing for a country to do. But as a way of buying learning, the evidence is discouraging: a randomised experiment that doubled Indonesian teachers’ base pay found that it significantly improved teachers’ satisfaction with their income and produced no improvement in student learning (de Ree et al., 2018). The World Bank reached the same verdict on the certification allowance (World Bank, 2015), and its broader finding across countries is that the link between education spending and learning is weak and statistically insignificant once income per capita is taken into account (World Bank, 2018).
There is one more feature of a percentage worth noticing, which is that the category it applies to can stretch.
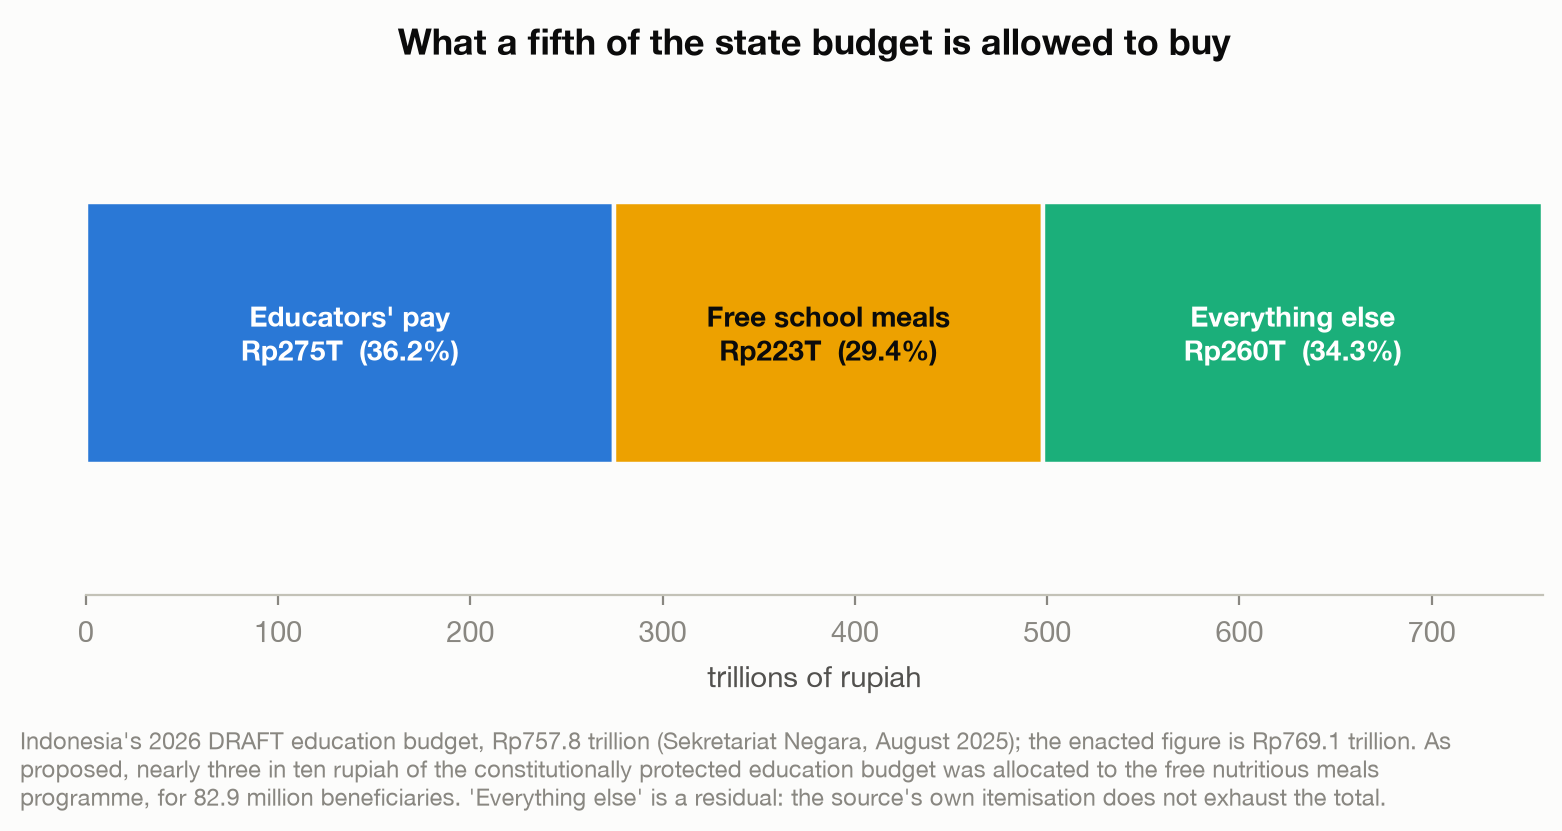
In the 2026 draft budget, Rp223 trillion of the Rp757.8 trillion education allocation, 29.4% of it, was the free nutritious meals programme, serving 82.9 million beneficiaries (Sekretariat Negara Republik Indonesia, 2025). That is nearly three in every ten rupiah of the protected education budget, as proposed, in a category the constitution names as education. Educator salaries were later held to count inside that category, and school meals are inside it now.
What a percentage promises
The rule worked, in the narrow sense that rules work. It was written down, it was ignored, it was enforced by a court that was willing to void an entire budget law, and it has been honoured nationally every year since 2009. As constitutional commitments go, that is a success.
It is just that the thing it commits to is an input. A budget share is countable, auditable and justiciable, which is exactly why it was the thing that got written down. Learning is none of those. No court can strike down a budget for producing children who cannot read a paragraph, because there is no number in the law for it to strike down.
So the next time any government anywhere promises a percentage of something to something you care about, and the number sounds impressive, ask the three questions this one invites. What is it a percentage of? What counts as inside the category? And what is it allowed to buy? Indonesia’s answers are that a fifth of the budget is three percent of the economy, that the boundary has moved twice, and that a large share of it is now a meal. The promise was kept. The girl still cannot read the page.
Method notes
Every figure here comes from a primary source; there is no dataset behind this post. The constitutional text is the Fourth Amendment to the 1945 Constitution, Article 31 paragraph 4. The compliance history comes from two Constitutional Court decisions, 026/PUU-IV/2006 and 13/PUU-VI/2008, and from Ministry of Finance budget documents, which date full compliance from 2009 at the national level.
On the learning poverty figure: the 53% is published in a World Bank brief dated April 2024, but it is computed from TIMSS grade four results collected in 2015 and enrolment data from 2014, so it is a pre pandemic measurement and is described that way in the text. The World Bank also notes such estimates can differ from official national statistics.
On the budget arithmetic: budget figures are from Informasi APBN for 2024, 2025 and 2026, and GDP is the World Bank series for Indonesia in current local currency. The 2026 composition is from the draft budget announced in August 2025, on a then proposed education allocation of Rp757.8 trillion; the enacted 2026 education budget is Rp769.1 trillion. The “everything else” segment of that chart is a residual, because the source’s own itemisation does not exhaust the total. One definitional point matters for every ratio here: the education budget’s numerator includes a financing component, the state education endowment, of Rp77.0 trillion in 2024 and Rp80.0 trillion in 2025, which is not part of state expenditure. Measuring expenditure against expenditure gives about 17.7% of the budget rather than 20.0%, and about 2.7% of GDP rather than 3.00%. Indonesia’s share of GDP is computed from its own budget documents rather than the World Bank and UNESCO series, which reports recent Indonesian values that are not consistent with those documents, and the cause of that break is not something I could verify; the peers in that chart do use the World Bank and UNESCO series for years between 2022 and 2024, so the comparison is not strictly like for like and the narrower Indonesian figure is given alongside it.
On PISA: trends are comparable only from 2000 for reading, 2003 for mathematics and 2006 for science, and each series in the chart starts at its own first comparable cycle. Indonesia sat PISA 2015 on paper and PISA 2018 on computer, a mode change that coincides with the largest single fall in the reading series. Two caveats are load bearing and are stated in the text: scores fell across the OECD between 2018 and 2022, which the OECD says is only partly attributable to the pandemic; and rapid enrolment expansion mechanically lowers a mean score, which is why the OECD’s adjusted reading of Indonesia differs from the raw one. That adjustment is an estimate at the 75th percentile of all fifteen-year-olds, not a recalculated average, so it should be read as a direction rather than a corrected score. Only two coverage figures are published for Indonesia, 46% and 85%, and only those two are plotted; I make no claim about coverage in 2022.
Nothing here should be read as evidence that education spending does not work. Indonesia sits far below the level at which more spending stops predicting better results, and below that level the OECD finds higher spending is associated with higher scores. The child in the opening is an illustrative composite drawn from the learning poverty statistic, not a real individual. This is a description of how a rule behaves, not a verdict on any government, party or programme. Three Kaggle datasets on related topics were reviewed and rejected as simulated before this post was built, including one whose files are named “Real_Budget” and which contains no World War II. Code and sources are on GitHub: github.com/joechrisnaldy/data-stories.
References
de Ree, J., Muralidharan, K., Pradhan, M., & Rogers, H. (2018). Double for nothing? Experimental evidence on an unconditional teacher salary increase in Indonesia. The Quarterly Journal of Economics, 133(2), 993-1039. https://doi.org/10.1093/qje/qjx040
Kementerian Keuangan Republik Indonesia. (2023). Informasi APBN tahun anggaran 2024 [Information on the 2024 state budget]. https://media.kemenkeu.go.id/getmedia/a760f574-2f6a-4d7a-b811-5fe4e92ee38a/Informasi-APBN-Tahun-Anggaran-2024.pdf
Kementerian Keuangan Republik Indonesia. (2024). Informasi APBN tahun anggaran 2025 [Information on the 2025 state budget]. https://media.kemenkeu.go.id/getmedia/c4cc1854-96f4-42f4-95b8-94cf49a46f10/Informasi-APBN-Tahun-Anggaran-2025.pdf
Mahkamah Konstitusi Republik Indonesia. (2007). Putusan Nomor 026/PUU-IV/2006 [Decision No. 026/PUU-IV/2006, review of Law No. 18 of 2006 on the 2007 state budget]. https://www.mkri.id/public/content/persidangan/putusan/putusan_sidang_Putusan026PUU-IV06ttgAPBN2007tgl010507.pdf
Mahkamah Konstitusi Republik Indonesia. (2008). Putusan Nomor 13/PUU-VI/2008 [Decision No. 13/PUU-VI/2008, review of Law No. 16 of 2008 amending the 2008 state budget]. https://www.mkri.id/public/content/persidangan/putusan/putusan_sidang_Putusan%2013-PUU-VI-2008.pdf
Majelis Permusyawaratan Rakyat Republik Indonesia. (2002). Perubahan keempat Undang-Undang Dasar Negara Republik Indonesia Tahun 1945 [Fourth amendment to the 1945 Constitution of the Republic of Indonesia].
OECD. (2019). PISA 2018 results: Country note, Indonesia. OECD Publishing. https://www.oecd.org/pisa/publications/PISA2018_CN_IDN.pdf
OECD. (2023a). PISA 2022 results (Volume I): The state of learning and equity in education. OECD Publishing. https://doi.org/10.1787/53f23881-en
OECD. (2023b). PISA 2022 results (Volume I and II): Country notes, Indonesia. OECD Publishing. https://doi.org/10.1787/ed6fbcc5-en
OECD. (2023c, December 5). Decline in educational performance only partly attributable to the COVID-19 pandemic [Press release]. https://www.oecd.org/en/about/news/press-releases/2023/12/decline-in-educational-performance-only-partly-attributable-to-the-covid-19-pandemic.html
OECD. (2025). Revenue statistics in Asia and the Pacific 2025: Indonesia [Country note]. OECD Publishing.
Sekretariat Negara Republik Indonesia. (2025, August 21). Alokasi anggaran pendidikan 2026 Rp757,8 triliun, naik 9,8 persen dari outlook 2025 [2026 education budget allocation of Rp757.8 trillion, up 9.8 percent from the 2025 outlook].
UNESCO Institute for Statistics. (2026). Indonesia education indicators [Data set]. Retrieved July 27, 2026, from https://api.uis.unesco.org/
World Bank. (2015). Indonesia: Teacher certification and beyond. An empirical evaluation of the teacher certification program and education quality improvements in Indonesia (Report No. 94019-ID). World Bank Office Jakarta.
World Bank. (2018). World development report 2018: Learning to realize education’s promise. https://doi.org/10.1596/978-1-4648-1096-1
World Bank. (2020). Revealing how Indonesia’s subnational governments spend their money on education: Subnational education public expenditure review 2020.
World Bank. (2024). Indonesia learning poverty brief (April 2024, Version 2). https://documents.worldbank.org/en/publication/documents-reports/documentdetail/099082924151529593
World Bank. (2026). World development indicators: Indonesia [Data set, including GDP in current local currency, NY.GDP.MKTP.CN]. Retrieved July 27, 2026, from https://data.worldbank.org/country/indonesia
// About the author
Jonathan Chrisnaldy is a product manager and analyst in New York City, with an M.S. in Technology Management from Columbia University. He writes data stories about the numbers behind everyday claims. More on the experience page or LinkedIn.