· 17 min read · Jonathan Chrisnaldy
The Dip I Waved Away
In late 2020 I wrote that Bitcoin was more stable and safer than Indonesia's LQ45 stocks. I saw the dip and waved it away. Here is the test I should have run, against the S&P 500 and gold.
In late 2020 I started a research proposal, in Indonesian, on whether Covid-19 and Indonesia’s LQ45 stock index moved the price of Bitcoin. I never finished it. Chapter one exists; the rest are headings. But chapter one had already reached its answer. Bitcoin, I wrote, was “much more stable” than the stocks and “tended to rise”. My draft noted a fall on 11 March, then a significant rise again. So during a pandemic, Bitcoin was “more promising and safer” than buying LQ45 stocks. (The quotes are my translation.)
This post audits that claim in public, with current data. Two things change. It goes global: instead of LQ45 it tests the claim against the S&P 500, the index readers are more likely to know, so the verdict is on the general claim that Bitcoin was steadier and safer than stocks, not on Indonesian stocks in particular. And it adds gold. The daily tests, and what would count as passing them, were written down before I downloaded any data.
Two dates, and the path between them
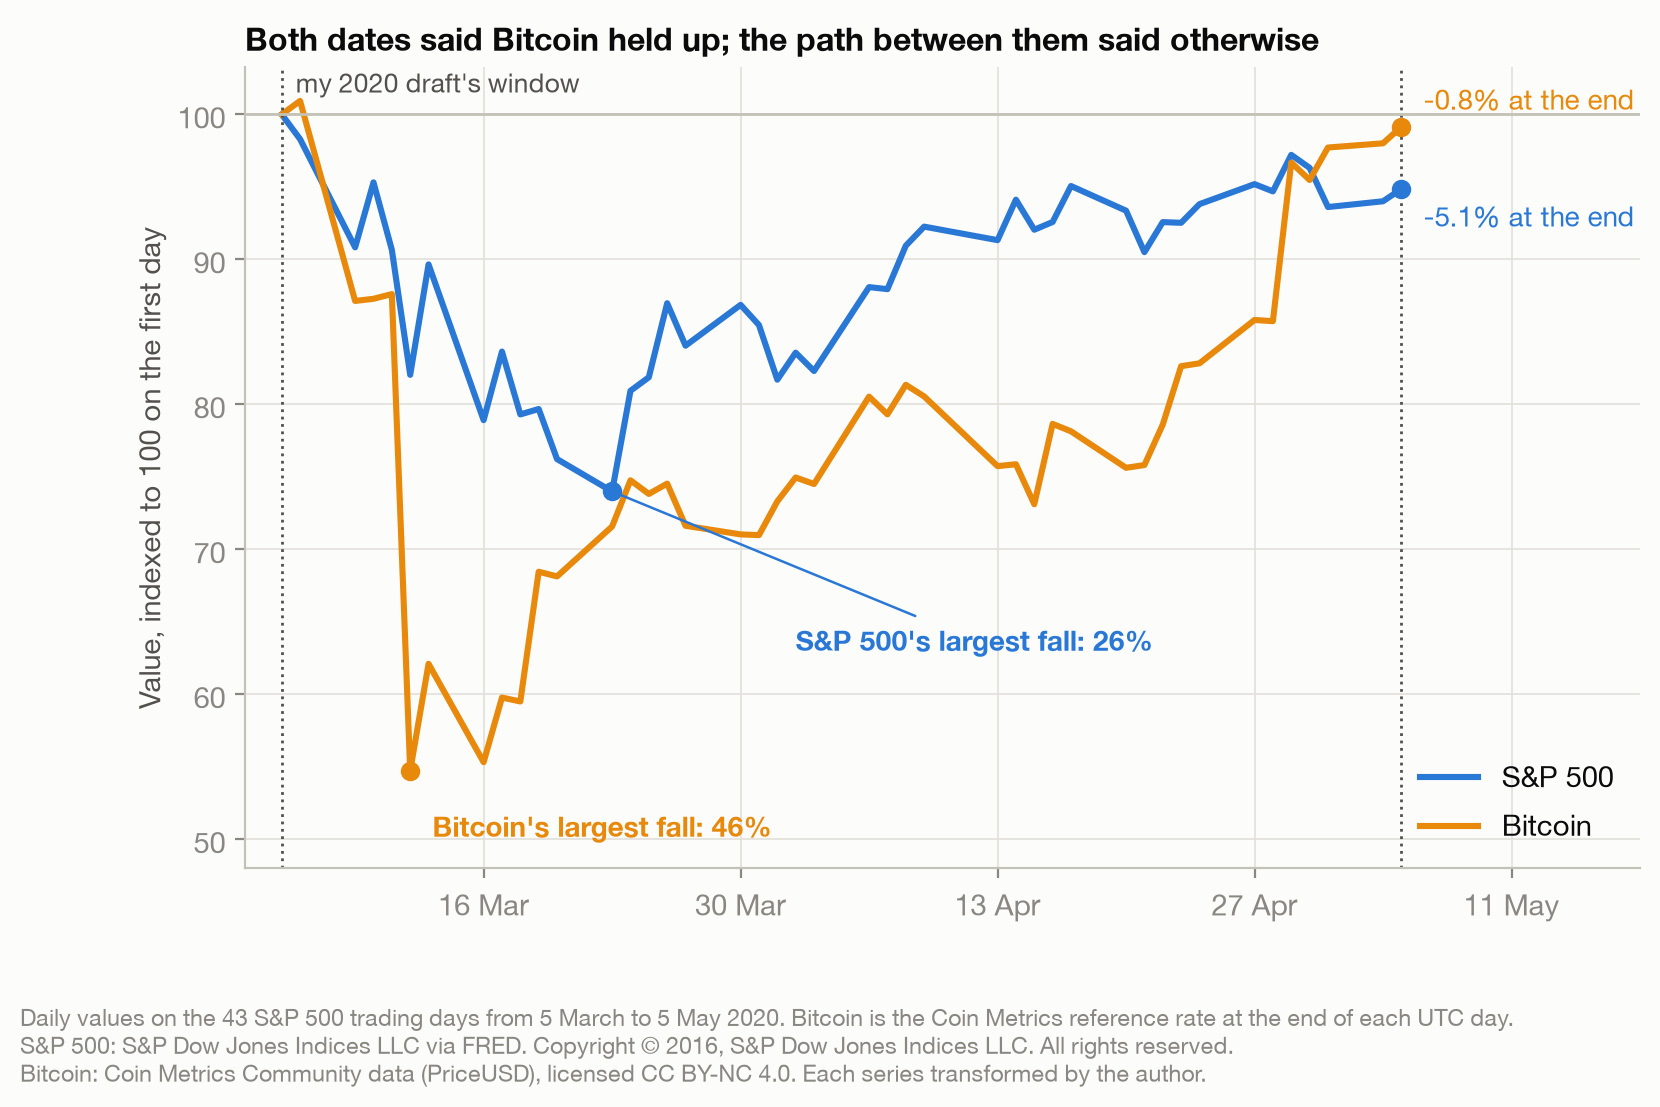
My draft’s window ran from 5 March to 5 May 2020. Bitcoin finished the window at minus 0.8 percent and the S&P 500 at minus 5.1 percent. Judged by its endpoints, Bitcoin did better.
Now look between them. Bitcoin’s largest fall inside the window was 46 percent, bottoming on 12 March. The S&P 500’s largest fall was 26 percent, bottoming on 23 March. Bitcoin’s daily volatility, the standard deviation of its log returns from one S&P 500 trading day to the next, was 9.2 percent against 4.5 percent for the index, across 43 trading days.
That is the dip I waved away. My draft saw it, called the recovery significant, and kept going. The recovery was real. It was a recovery from a fall of 46 percent, in the asset I had just called much more stable.
Before downloading anything, I wrote down what the 2020 claim had to show to survive: Bitcoin’s largest fall in that window had to be smaller than the S&P 500’s, and its daily volatility lower. It failed on both counts. In the words I committed to in advance: the 2020 claim was wrong.
What “safe” means, and a test you can run
The finance literature has a precise version of what I was reaching for. Dirk Baur and Brian Lucey split it in two. An asset is a hedge if it is uncorrelated or negatively correlated with stocks on average, and a safe haven if it is uncorrelated or negatively correlated with stocks in extreme market conditions (Baur & Lucey, 2006). Baur and McDermott then split the safe haven into weak, an asset uncorrelated with stocks in those conditions, and strong, an asset negatively correlated with them, and note that the weak kind on average keeps its value when the market falls while the strong kind gains (Baur & McDermott, 2009).
Their tests are regressions with extra terms for the market’s worst days. Mine is not their test. It asks the value question directly, and anyone with a spreadsheet can run it:
- Take the stock market’s worst days, here the S&P 500’s worst 5 percent of days.
- Average what your asset did on those days, and put a 95 percent confidence interval around that average.
- If the whole interval sits below zero, it is not a safe haven. If it includes zero, call it a weak safe haven. If the whole interval sits above zero, a strong safe haven.
The weak bar is generous. A volatile asset gets a wide interval, and a wide interval is more likely to include zero. The strong bar has a weakness too: an asset that usually rises can clear it without being negatively correlated with anything.
The worst days
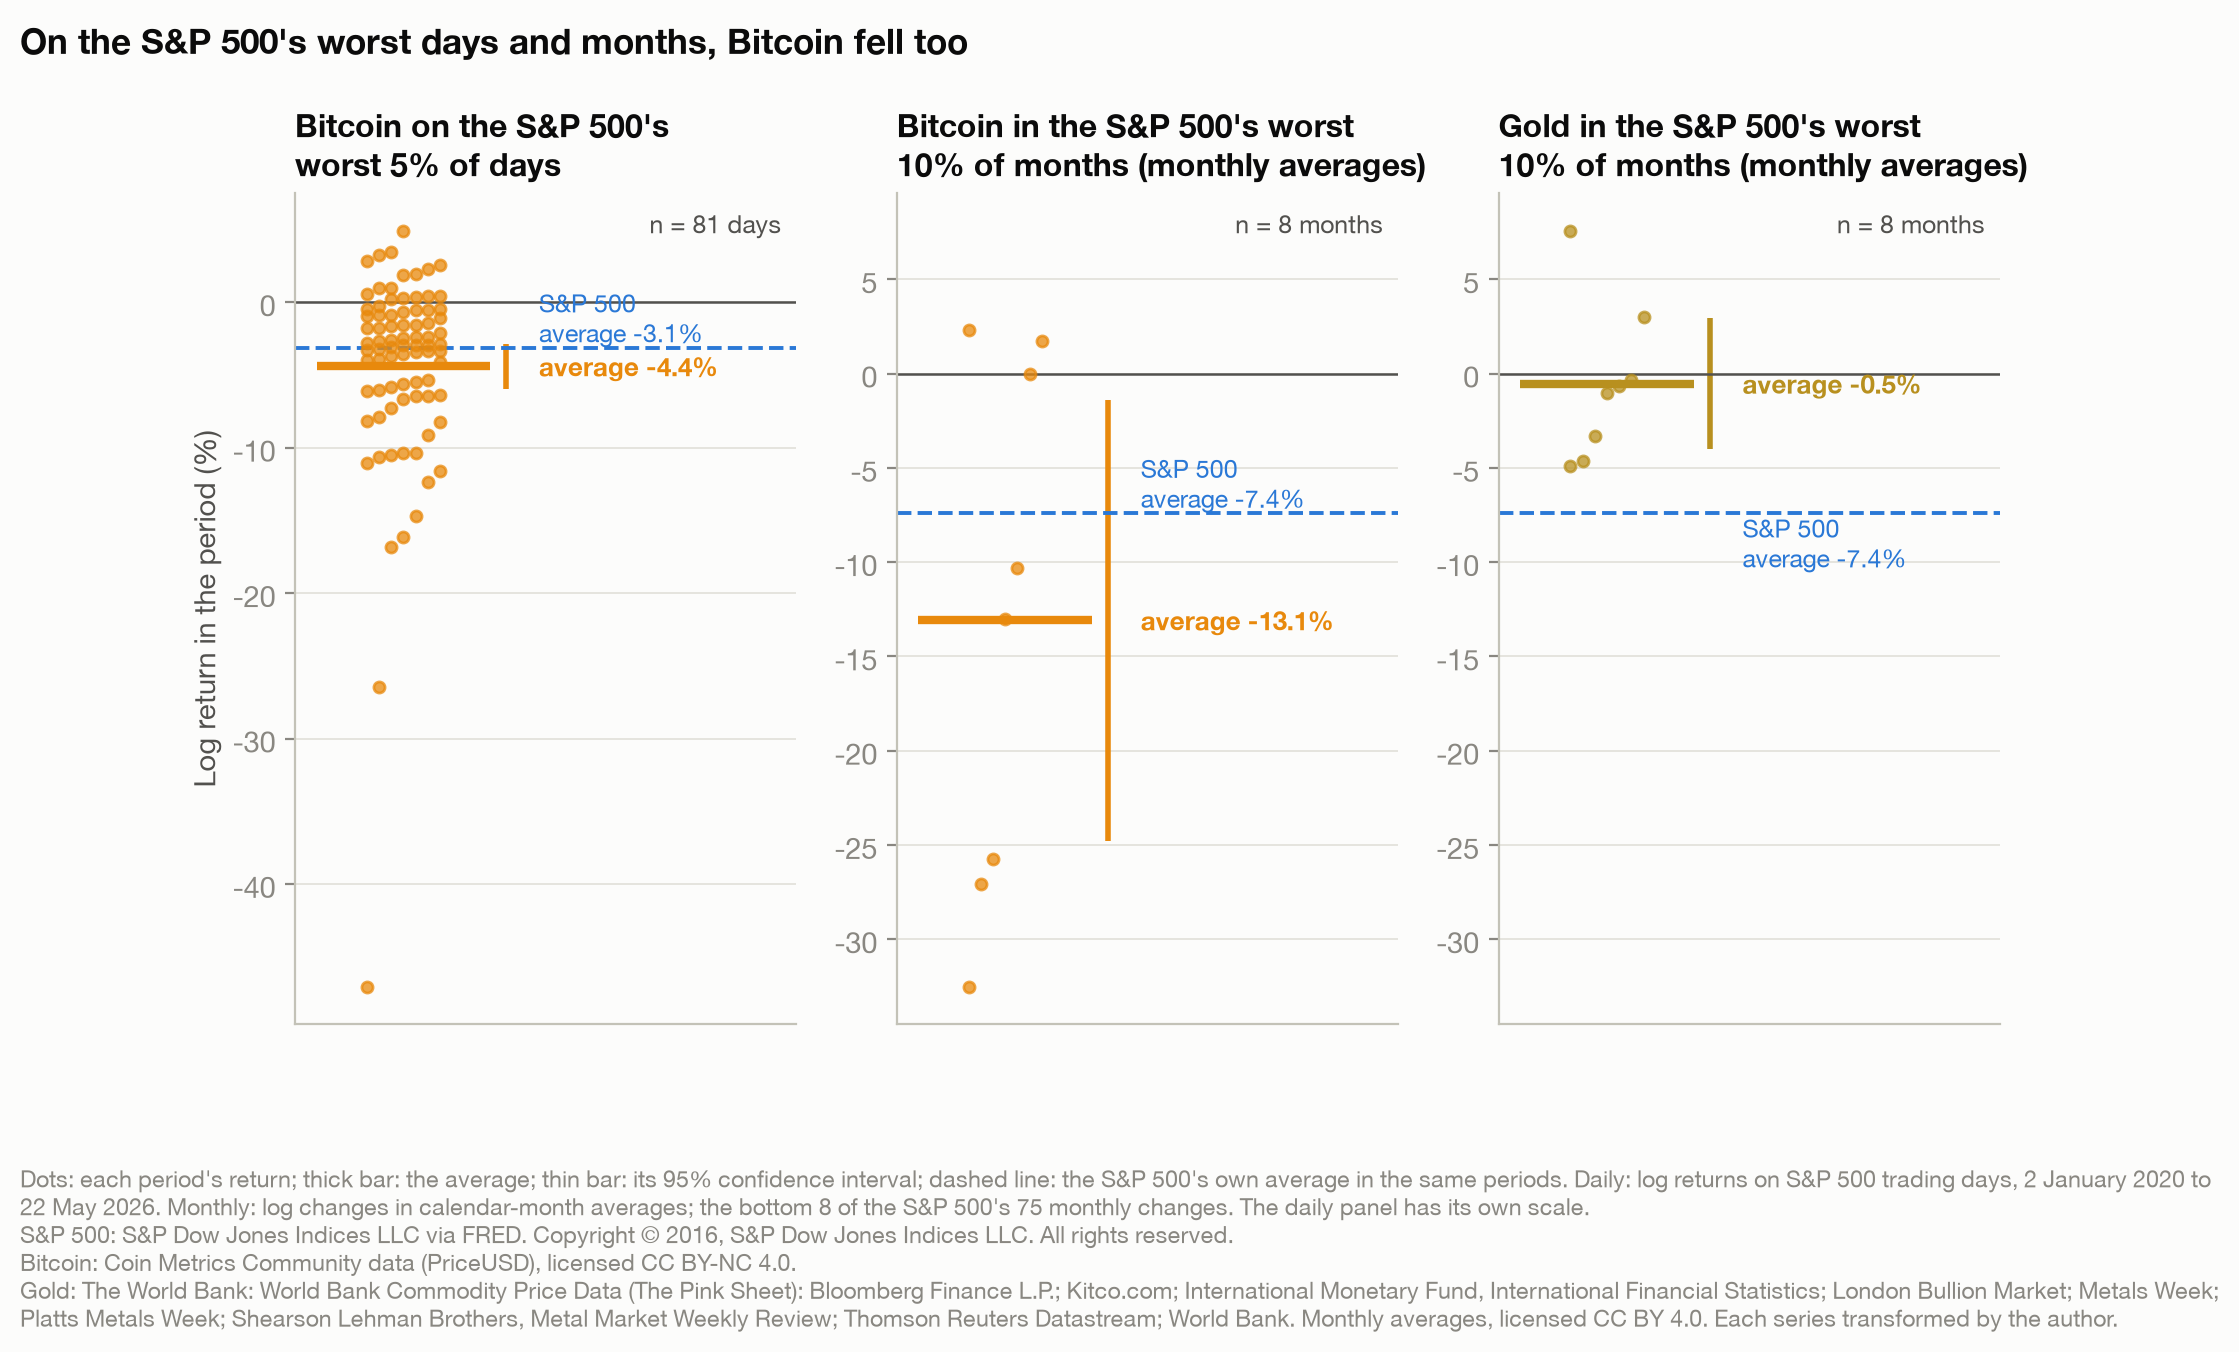
From 2 January 2020 to 22 May 2026 there were 1,605 daily returns, so the S&P 500’s worst 5 percent of days is 81 days. On those days the S&P 500 averaged minus 3.1 percent. Bitcoin averaged minus 4.4 percent, with an interval from minus 5.9 to minus 2.8, and it rose on 16 of the 81 days. By my own test, Bitcoin was not a safe haven.
It does not rest on the Covid crash. Drop the days from the S&P 500’s February 2020 high to its March low and the S&P 500’s worst 5 percent of the remaining days is 80 days, on which Bitcoin averaged minus 3.7 percent: the same verdict. Counting that check, I ran eight variations of the test, adding the worst 1 percent of days and two-day returns, which allow for Bitcoin’s price being taken a few hours after the stock market closes. The verdict held in six of them. It did not hold for the worst 1 percent of two-day periods, where nine periods remain and the interval includes zero.
Gold is harder. I could not find a free daily gold price whose terms let a blog publish charts made from it, so gold comes from the World Bank’s monthly average price (World Bank, 2026), and the comparison has to be monthly as well: Bitcoin, gold and the S&P 500 as calendar-month averages, which dampen how deep a crash month looks. In the S&P 500’s worst 10 percent of months, eight of 75, the S&P 500 averaged minus 7.4 percent. Gold averaged minus 0.5 percent, rising in two of the eight months, with an interval from minus 4.0 to plus 3.0: a weak safe haven by my test. Bitcoin averaged minus 13.1 percent, with an interval from minus 24.8 to minus 1.4: not a safe haven by my test.
Eight months is a small sample, and the monthly verdict on Bitcoin does rest on the Covid crash. Leave out 2020 and the S&P 500’s worst 10 percent of months is seven of 64, in which Bitcoin averaged minus 10.3 percent with an interval from minus 21.8 to plus 1.2. That includes both zero and the S&P 500’s own average of minus 5.5 percent, so the monthly test cannot tell. Gold’s verdict held without 2020 and in the S&P 500’s worst 20 percent of months.
Each big fall since 2020
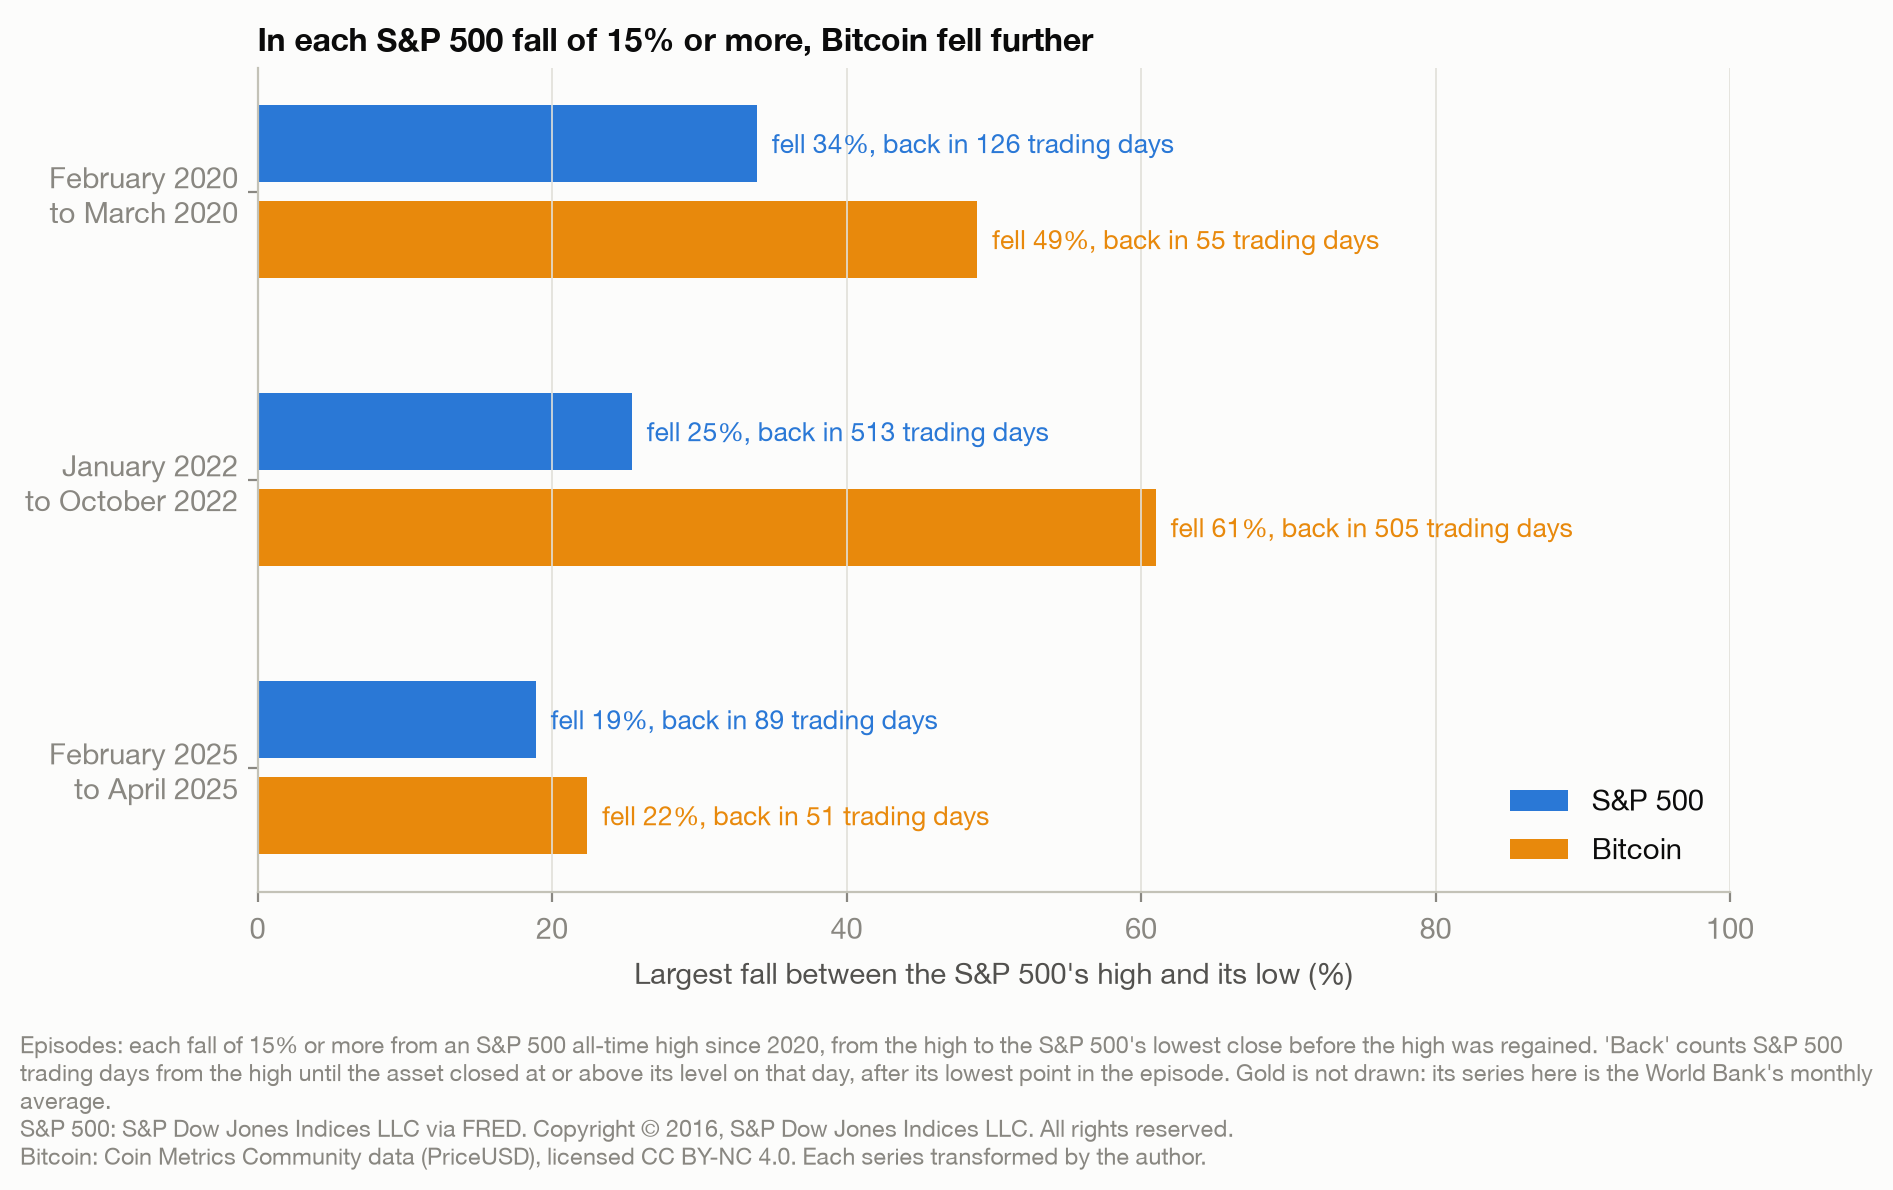
My rule for a stress episode: a fall of 15 percent or more from an S&P 500 all-time high, running from that high to the lowest close before the high was regained. Since January 2020 there were three: February to March 2020, January to October 2022, and February to April 2025. A 10 percent threshold finds the same three.
Bitcoin fell further in each: 49 percent against the S&P 500’s 34, then 61 against 25, then 22 against 19. It also closed back at its level on the S&P 500’s high day, after its lowest point in the episode, sooner in each, counting S&P 500 trading days from that high: 55 against 126, 505 against 513, and 51 against 89. In the 2022 episode they were close.
A safe haven is supposed to hold its value while stocks are falling, not to recover sooner afterwards.
Digital gold, or something else
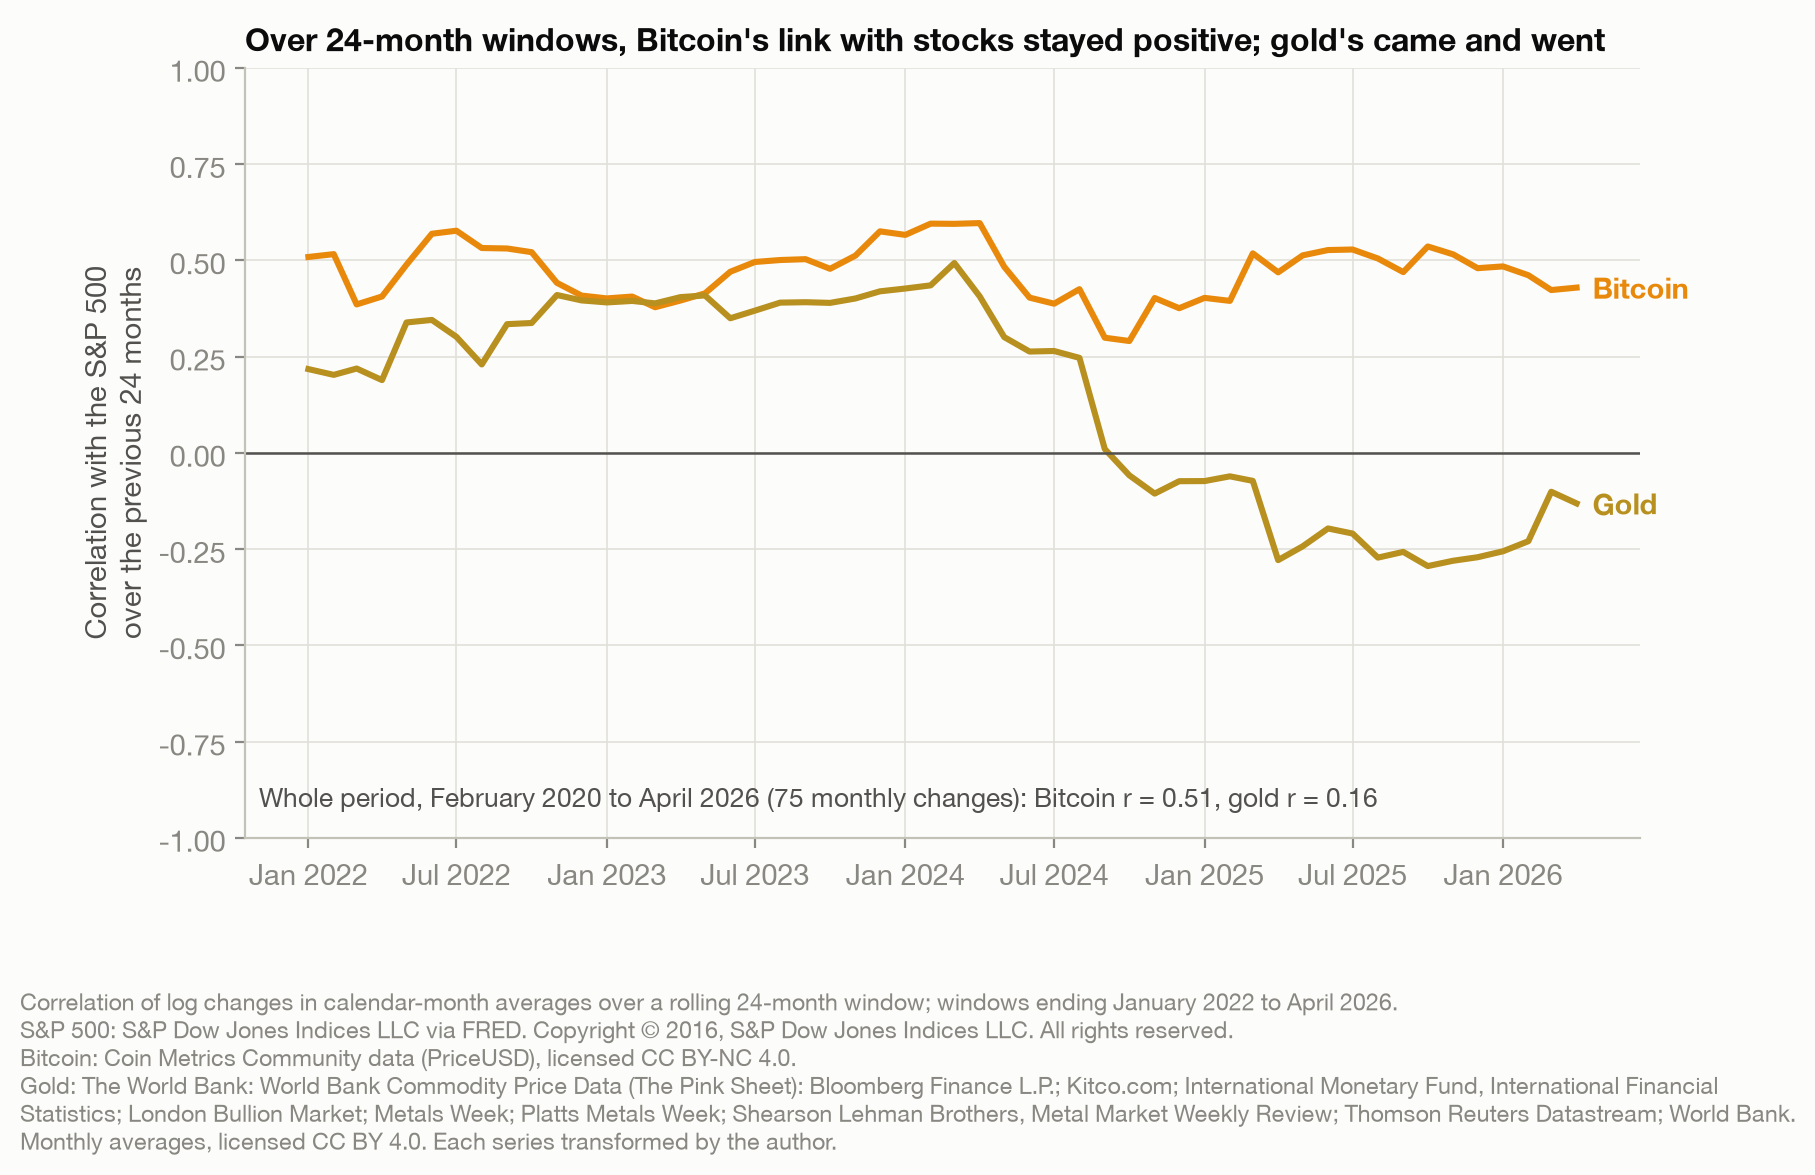
The hedge test asks about the average relationship. On daily returns, Bitcoin moved with the S&P 500 at a correlation of 0.40 across 1,605 daily returns. On monthly averages, like for like with gold, Bitcoin’s correlation was 0.51 and gold’s 0.16, across 75 monthly changes. Gold’s is small enough to be chance (p = 0.16). Bitcoin’s is not.
Over rolling 24-month windows, Bitcoin’s correlation with the S&P 500 stayed between 0.29 and 0.60. Gold’s swung between minus 0.29 and 0.49.
The Covid question I started with
My draft’s first question was whether Covid-19 cases moved the price of Bitcoin, and its planned method was a neural network. Here is what the data allows.
Some countries group several days into one report (World Health Organization, n.d.), so I summed world cases by week. The window touches ten weeks. Week-on-week growth in world cases correlated with Bitcoin’s weekly return at minus 0.50 (p = 0.14) and with the S&P 500’s at minus 0.54 (p = 0.11). With ten points, and with case growth slowing over the same weeks that markets recovered, those correlations do not separate Covid from the rest of what happened that spring. The counts have gaps too: the daily counts have no new-case figures for France in those weeks.
My planned neural network would have been trained on daily data from 5 March to 5 May 2020: a single stretch of a single spring, and no way to tell what else was happening. The question was a fair question to ask. The method could not have answered it.
What I would tell my 2020 self
The endpoints said Bitcoin held up; the path said it fell 46 percent on the way.
Run the test before using the word. Take the stock market’s worst days, average what the asset did on them, and check whether the interval clears zero. Then check it again with the big crash left out. On that test, over these years, Bitcoin fell with stocks.
This is an audit of my own old claim, not investment advice. No sentence here recommends buying or selling anything.
Method notes
Data. The S&P 500 is FRED’s daily close of the price index, which excludes dividends (S&P Dow Jones Indices LLC, 2026). Bitcoin is the Coin Metrics reference rate, PriceUSD (Coin Metrics, 2024), from the free data archive of Coin Metrics, Inc. (Coin Metrics, 2026). Gold is the World Bank’s monthly average price in US dollars per troy ounce (World Bank, 2026): the average of daily London afternoon fixings to May 2025 and of daily spot rates from June 2025. Gold’s verdicts are the same without the May and June 2025 changes. Covid-19 cases are the daily counts, summed by week (World Health Organization, 2023). I transformed each series: rebased, converted to returns, averaged or summed as described above.
Credits and notices. This is a non-commercial post, not endorsed by FRED, the Federal Reserve Bank of St. Louis or any publisher of these data.
- S&P 500, as the notice reads on the FRED series page: Copyright © 2016, S&P Dow Jones Indices LLC. All rights reserved. Reproduction of S&P 500 in any form is prohibited except with the prior written permission of S&P Dow Jones Indices LLC (“S&P”). S&P does not guarantee the accuracy, adequacy, completeness or availability of any information and is not responsible for any errors or omissions, regardless of the cause or for the results obtained from the use of such information. S&P DISCLAIMS ANY AND ALL EXPRESS OR IMPLIED WARRANTIES, INCLUDING, BUT NOT LIMITED TO, ANY WARRANTIES OF MERCHANTABILITY OR FITNESS FOR A PARTICULAR PURPOSE OR USE. In no event shall S&P be liable for any direct, indirect, special or consequential damages, costs, expenses, legal fees, or losses (including lost income or lost profit and opportunity costs) in connection with subscriber’s or others’ use of S&P 500.
- Bitcoin: Coin Metrics, Inc., from github.com/coinmetrics/data, licensed CC BY-NC 4.0, and published by Coin Metrics “without any warranty”.
- Gold: The World Bank: World Bank Commodity Price Data (The Pink Sheet): Bloomberg Finance L.P.; Kitco.com; International Monetary Fund, International Financial Statistics; London Bullion Market; Metals Week; Platts Metals Week; Shearson Lehman Brothers, Metal Market Weekly Review; Thomson Reuters Datastream; World Bank. Licensed CC BY 4.0.
- Covid-19 cases: World Health Organization 2023 data.who.int, WHO Coronavirus (COVID-19) dashboard > More resources [Dashboard]. https://data.who.int/dashboards/covid19/more-resources. Licensed CC BY 4.0.
Samples. The daily layer runs from 2 January 2020 to 22 May 2026, 1,606 S&P 500 trading days; it ends where the free Coin Metrics archive ends. The monthly layer runs from January 2020 to April 2026, the last complete month for Bitcoin, gold and the S&P 500, which gives 75 monthly changes. The S&P 500’s and Bitcoin’s monthly averages are taken over each month’s S&P 500 trading days; gold’s is the World Bank’s monthly average.
Timing. Bitcoin’s price for a date is fixed at midnight UTC at the end of that day (Coin Metrics, 2024), a few hours after the S&P 500 closes (S&P Dow Jones Indices LLC, 2026), which is why the worst-days test was also run on two-day returns. Two-day returns can pair days starting from the first trading day or the second; both are reported in the repository, and the verdicts above hold for both except where the post says otherwise.
Returns. The worst-days and worst-months averages, their intervals, the volatility and the correlations use log returns, shown in percent. The falls and the window’s start-to-end changes are ordinary percentage changes. For moves of a few percent the difference is small; on Bitcoin’s extreme days it is not.
What was fixed in advance, and what was not. The questions, the daily tests and the conditions that would count as failing them were written before any data was downloaded. Three things changed after the data came in, each recorded with its date in the design document: FRED’s Bitcoin series was rejected, since it carries the next day’s price under a stretch of dates in 2024 and 2025; gold became monthly, for the licensing reason above; and the Covid aside became weekly. A code review then found a bug, a stress episode measured to the day the high was regained rather than to the low, which moved Bitcoin’s 2022 fall to the figure above. A few smaller choices were settled after the first results, and the design document marks them as such.
Scored conditions. The 2020 claim needed a smaller fall and lower volatility than the S&P 500; it had neither. By my test, Bitcoin was not a safe haven on daily data, with or without the Covid crash. Gold was a weak safe haven by this test on monthly data, with or without 2020. Bitcoin was not a safe haven by my monthly test with 2020 included, and the monthly test cannot tell without it.
What this does not show. Why any of these assets moved. Whether the pattern holds outside these years, which contain three large falls. Anything about other cryptocurrencies, bonds or other stock markets, including the LQ45 my draft started from.
References
Baur, D. G., & Lucey, B. M. (2006). Is gold a hedge or a safe haven? An analysis of stocks, bonds and gold (IIIS Discussion Paper No. 198). Institute for International Integration Studies, Trinity College Dublin. https://www.tcd.ie/triss/assets/PDFs/iiis/iiisdp198.pdf
Baur, D. G., & McDermott, T. K. (2009). Is gold a safe haven? International evidence (IIIS Discussion Paper No. 310). Institute for International Integration Studies, Trinity College Dublin. https://www.tcd.ie/triss/assets/PDFs/iiis/iiisdp310.pdf
Coin Metrics. (2024, April 3). Price. Data Knowledge Base. Retrieved October 9, 2026, from https://docs.coinmetrics.io/network-data/network-data-overview/market/price
Coin Metrics. (2026). coinmetrics/data: Free Coin Metrics data archives [Data set]. GitHub. Retrieved October 9, 2026, from https://github.com/coinmetrics/data
S&P Dow Jones Indices LLC. (2026). S&P 500 (SP500) [Data set]. FRED, Federal Reserve Bank of St. Louis. Retrieved October 9, 2026, from https://fred.stlouisfed.org/series/SP500
World Bank. (2026, October 2). World Bank commodity price data (The Pink Sheet): Monthly prices [Data set]. https://www.worldbank.org/en/research/commodity-markets
World Health Organization. (n.d.). About. WHO COVID-19 dashboard. Retrieved October 9, 2026, from https://data.who.int/dashboards/covid19/about
World Health Organization. (2023). WHO coronavirus (COVID-19) dashboard > More resources [Dashboard]. data.who.int. https://data.who.int/dashboards/covid19/more-resources
// About the author
Jonathan Chrisnaldy is a product manager and analyst in New York City, with an M.S. in Technology Management from Columbia University. He writes data stories about the numbers behind everyday claims. More on the experience page or LinkedIn.