· 8 min read · Jonathan Chrisnaldy
The Cheapest Degree Abroad Isn't the Best Deal
A master's in the USA costs about thirteen times one in Greece. But sticker price is the wrong ruler. Once you divide the cost by what you would actually earn, the bargain ranking reshuffles, and the cheapest countries stop being the best deals. Mexico looks cheap and is one of the worst.
A master’s degree in the USA costs about $154,000. The same degree in Greece costs about $12,000, roughly one thirteenth as much. If you shopped on price, the decision would be over before it started. But price is the wrong ruler. What a degree costs tells you almost nothing about whether it is worth it, and the country that looks cheapest can be one of the worst deals on the board.
When people weigh studying abroad, they weigh tuition. It is the number on every brochure, the number families argue over at dinner. For whether it pays, you need a second number the brochures never print: what you would earn once you have the degree. So I took a dataset of master’s programs across the rich world, and I did the division.
What it costs
Start with the sticker. Add up tuition over the whole degree, plus rent, visa, and insurance, and take the typical master’s in each country.
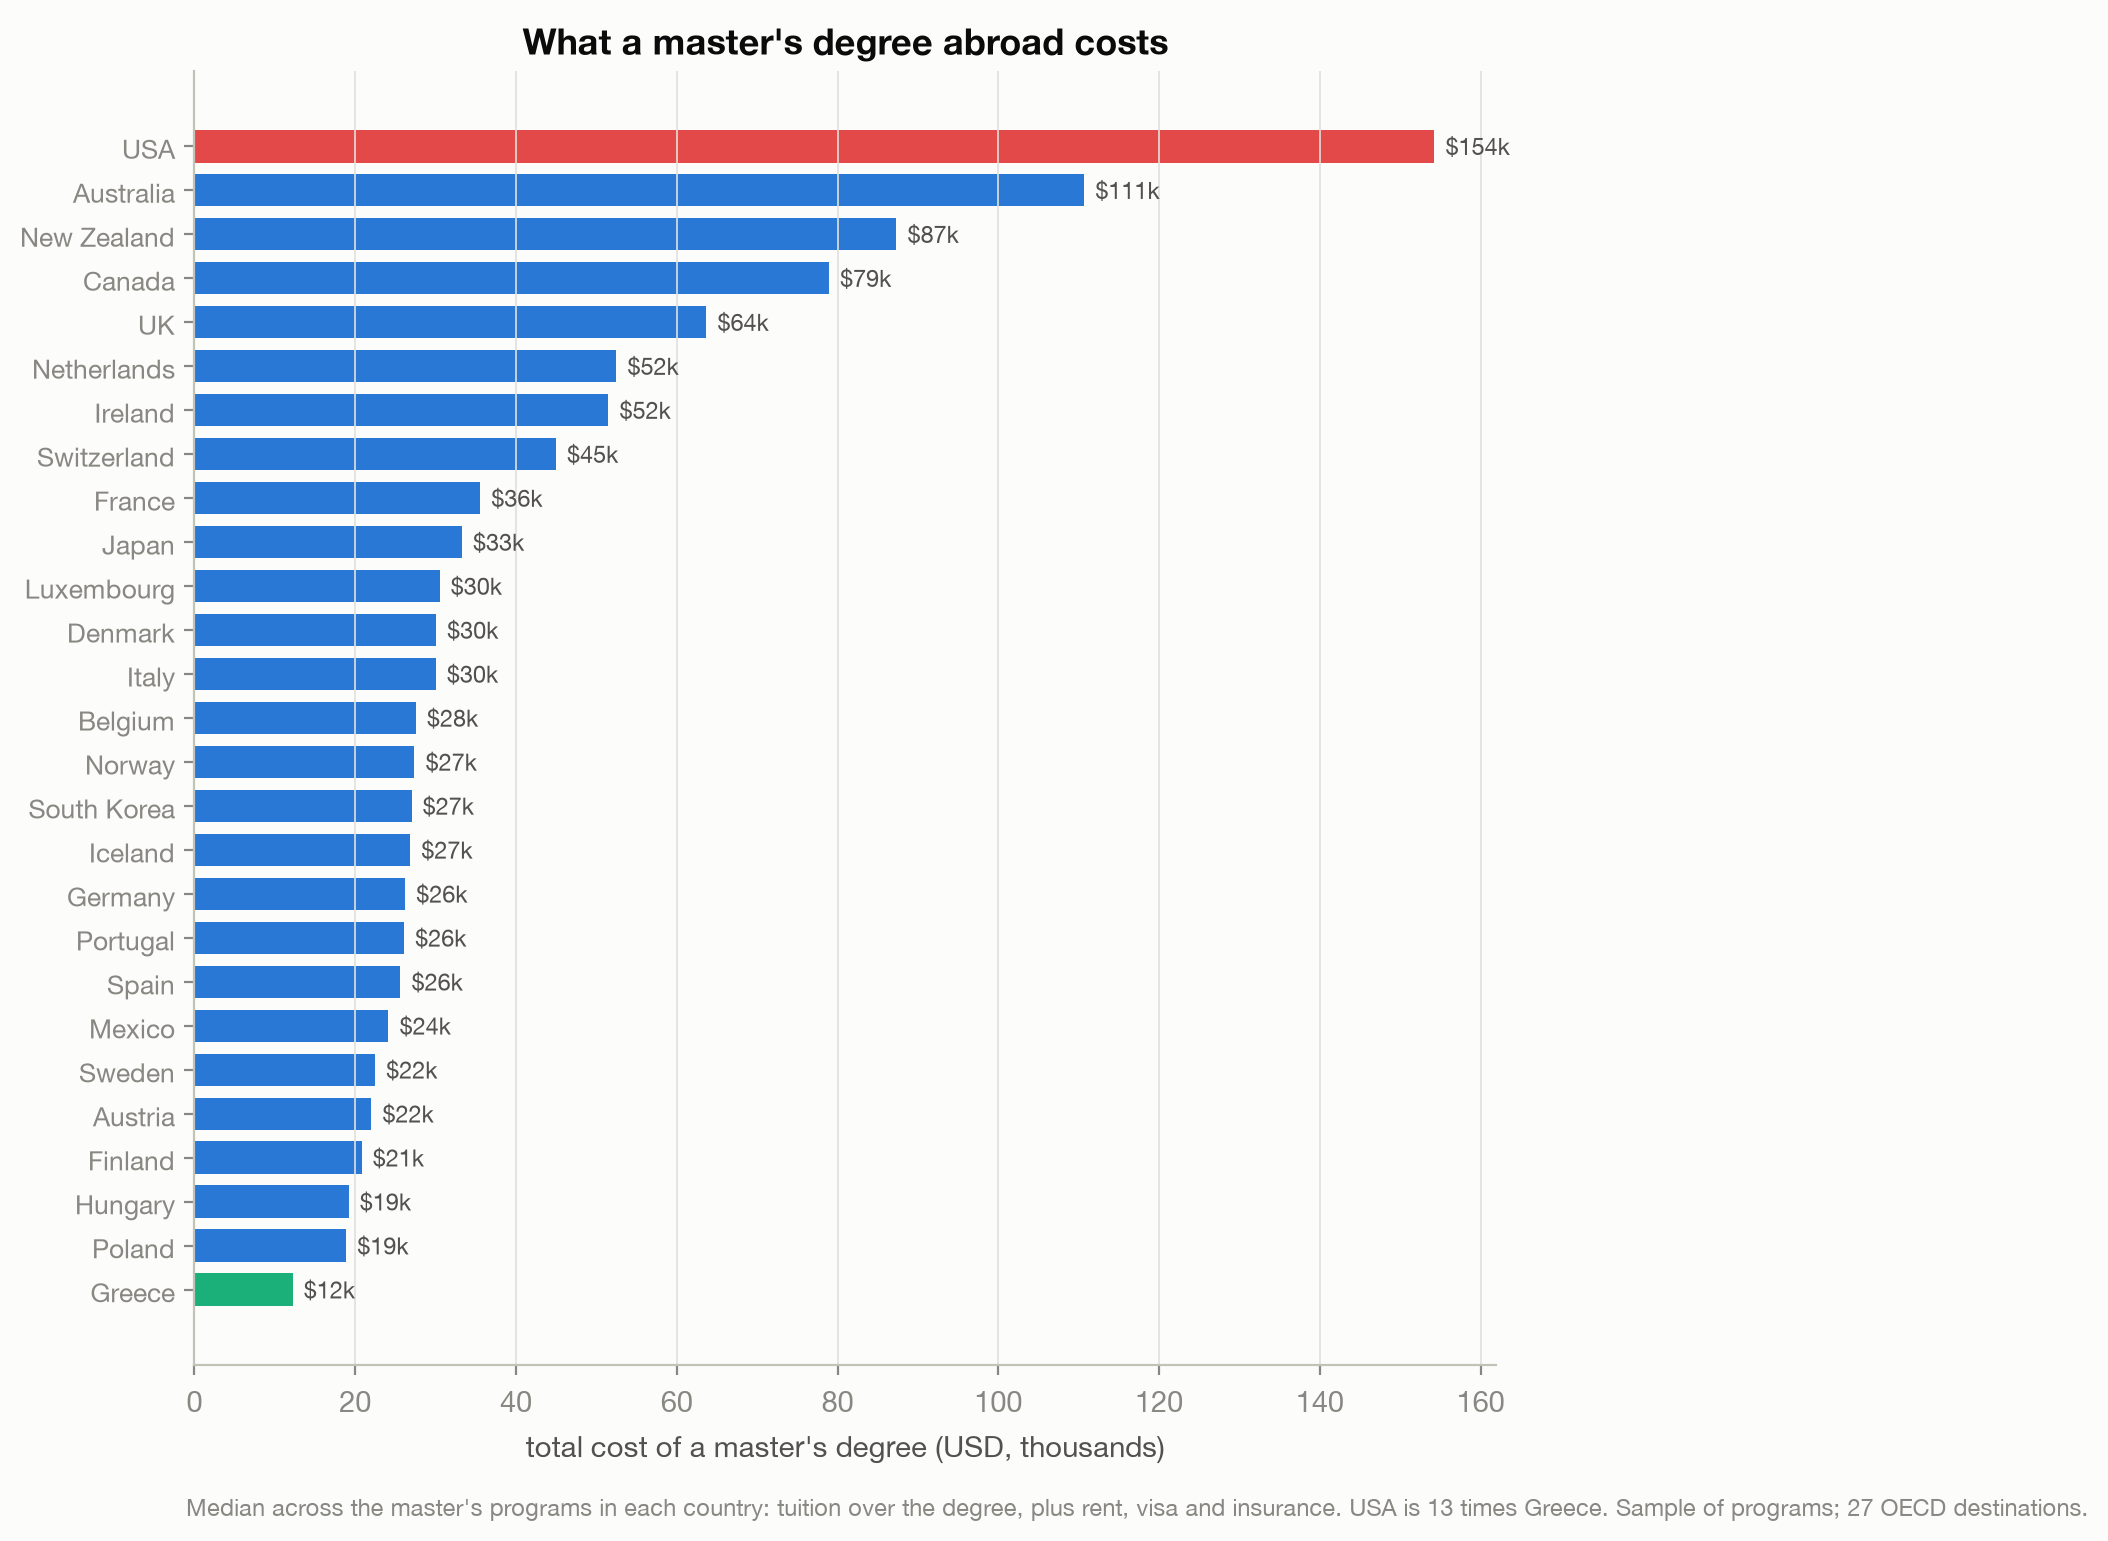
The order is the one you already carry in your head: the English-speaking world at the top (the USA, then Australia, New Zealand, and Canada), southern and eastern Europe at the bottom. This is the number every ranking of “cheapest places to study abroad” is built on. If cost were value, you would book a flight to Athens and never think about it again.
What it pays back
But cost is only half of a deal. The other half is what you get. So I divided each country’s degree cost by its average annual wage, which gives one clean, comparable number: how many years of the local average salary it takes to earn the degree back. (That wage is the local one, which quietly assumes you stay and work there. Hold that thought; it matters more than anything else here, and I come back to it.)
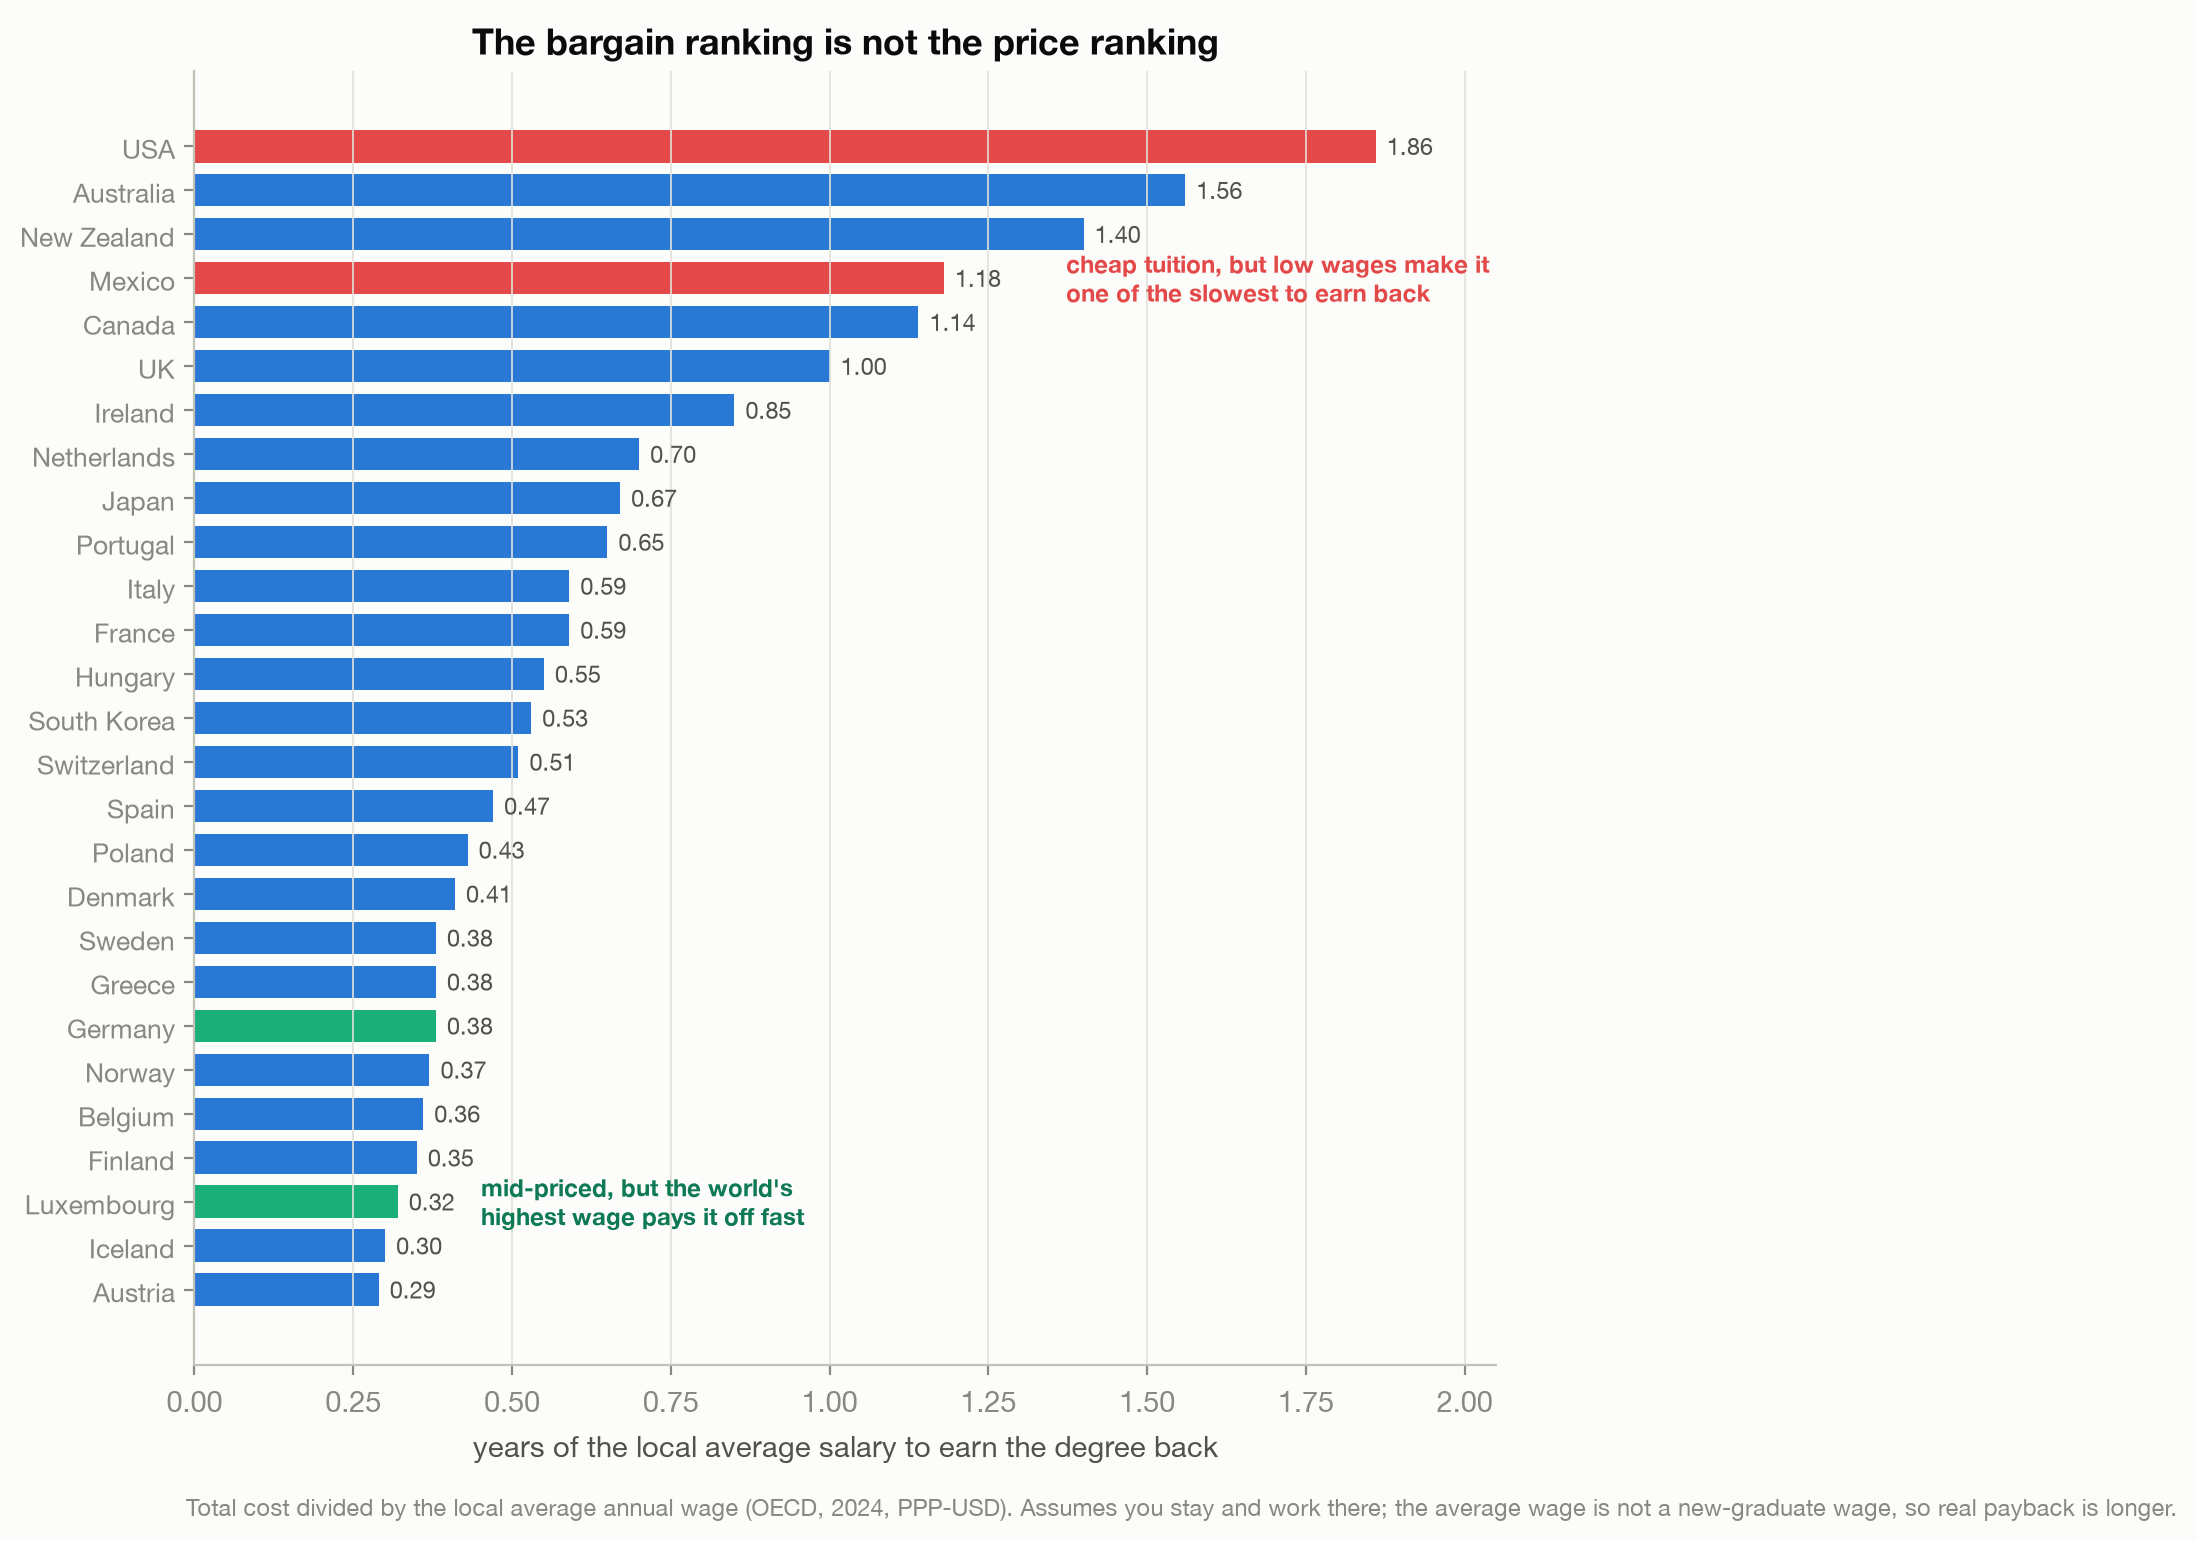
The ranking reshuffles. The USA is still the worst, at 1.86 years, because even an $83,000 average wage cannot quickly repay a $154,000 sticker. But watch the middle, where the surprises live. Mexico, one of the cheapest places to study, turns into one of the worst deals: at 1.18 years, its cheap tuition is undone by low local wages. Meanwhile Germany, Austria, and the Nordics, cheap tuition sitting on top of high wages, pay back in four to five months of salary. Luxembourg, mid-priced by sticker, pays back faster than almost anyone, because it has the highest average wage in this group. Cheap and good-value are not the same thing. The cost ranking and the payback ranking are related but far from identical (their rank correlation is 0.64); the sticker is a decent rough guide that goes wrong in exactly the cases you would most want it to be right, the ones in the middle.
And whether you can get a job
Payback assumes one more thing, and it is a big one: that you actually find work. So the third number is the employment rate.
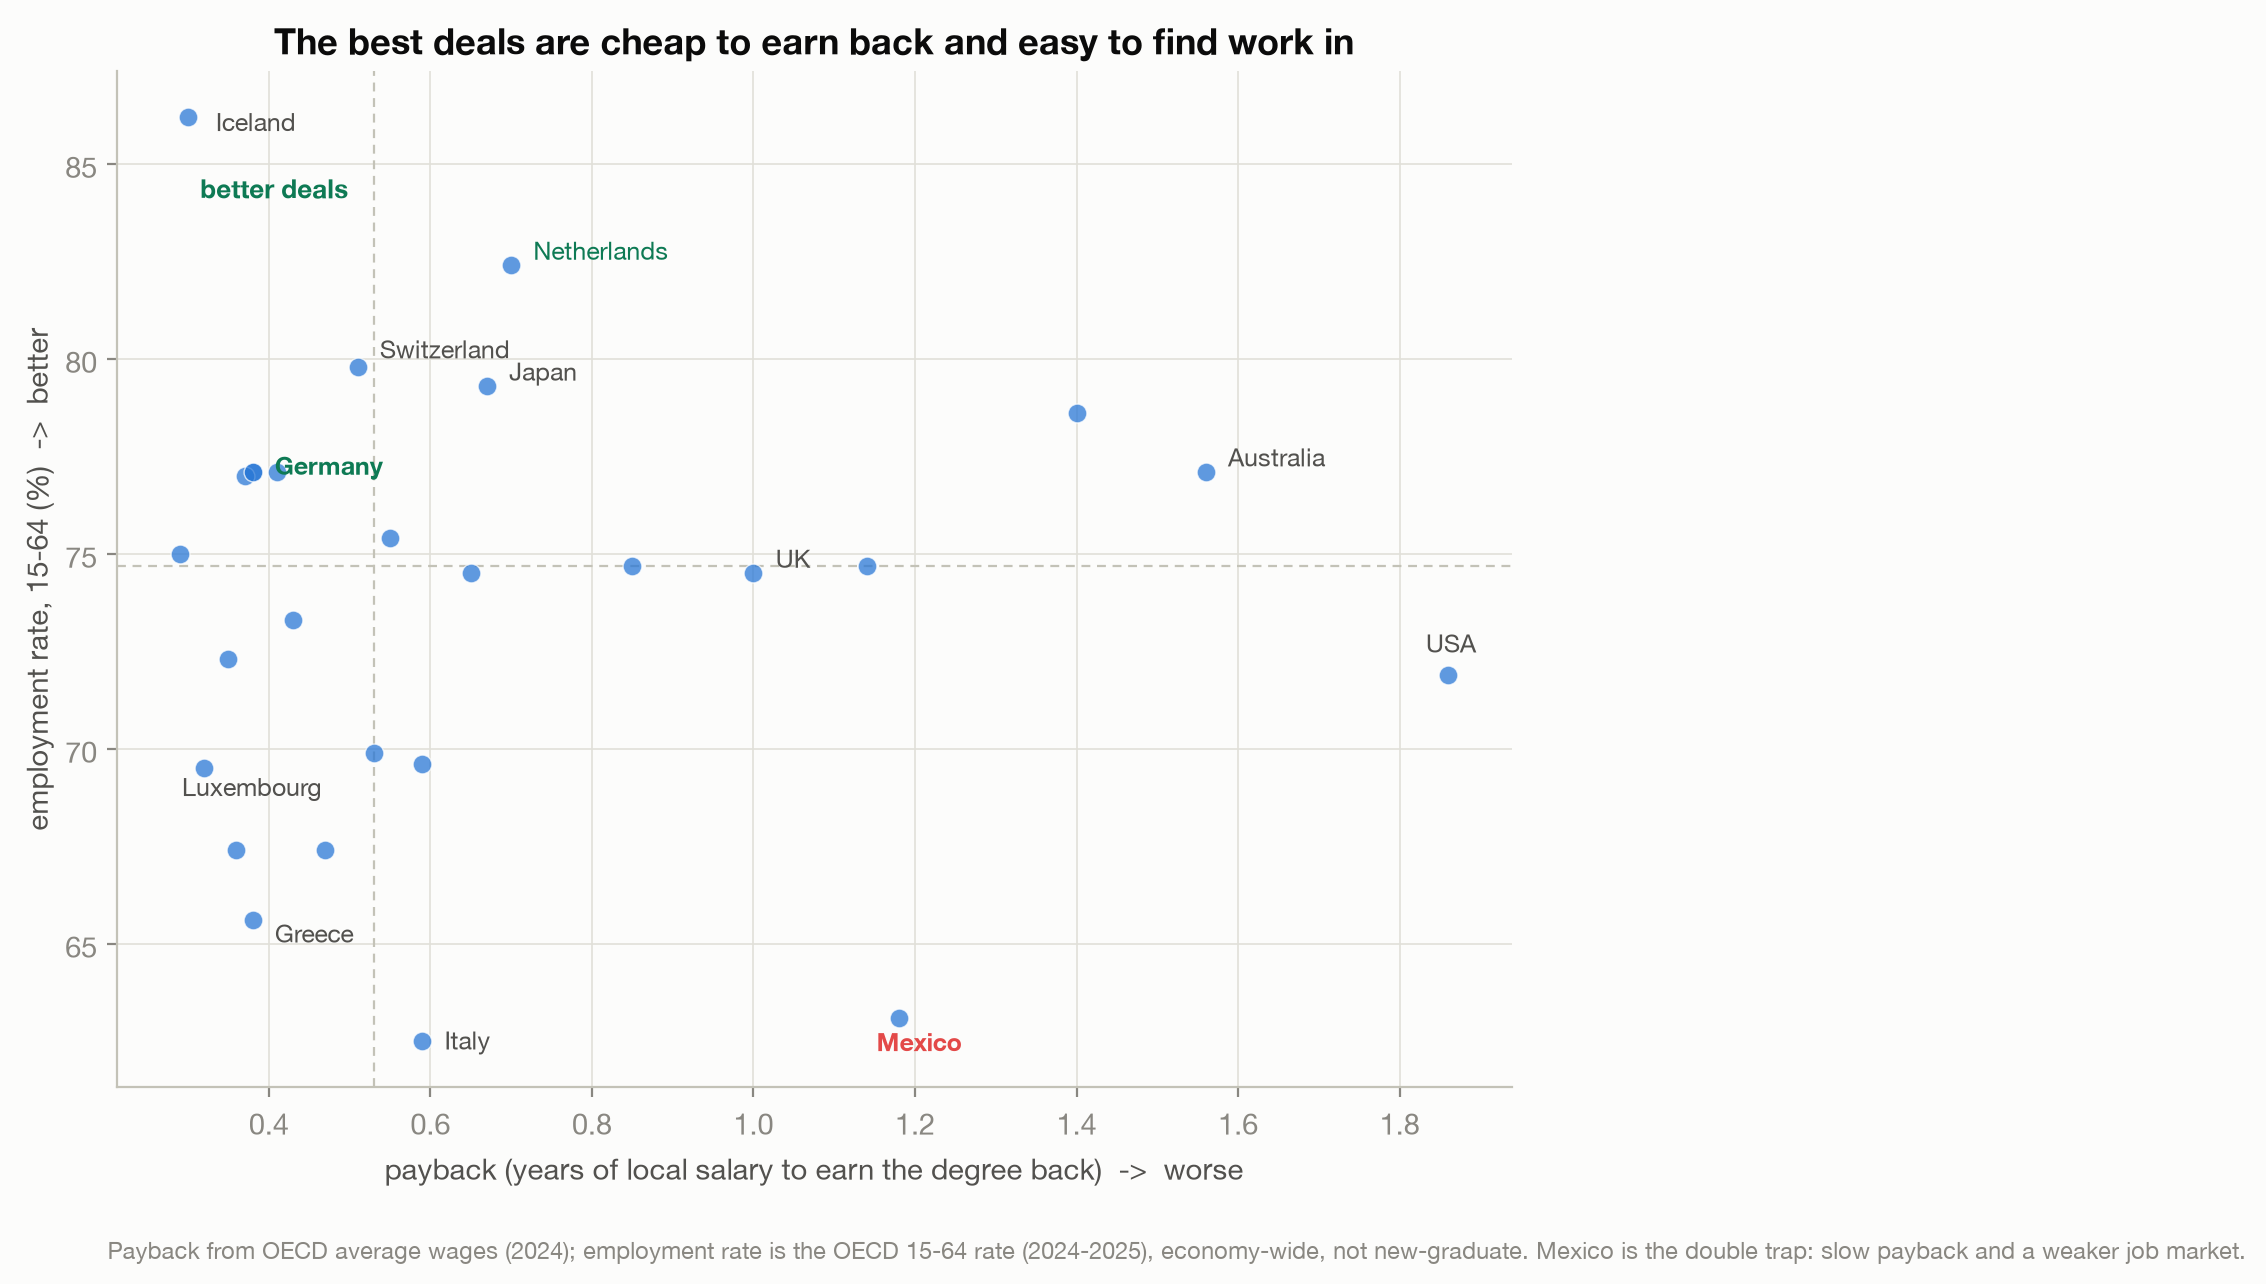
Plot payback against how easy it is to find a job, and the best deals gather in one corner: quick to earn back and a strong labor market. Germany, the Netherlands, Norway, and Iceland live there, with working-age employment rates running from about 77 to 86 percent. Mexico sits by itself in the opposite corner, slow payback and a weak job market at 63 percent employment, the double trap. And Greece, so cheap and fast to repay, has one of the lowest employment rates in the group, about 66 percent, so its bargain comes with an asterisk. The value of a degree is the payback and the odds of using it, together.
The number that undoes half of this
Now the caveat I flagged, and it is load-bearing. Every one of those wages belongs to the destination country, so the whole payback only holds if you stay and work there. Most international students cannot. Visas expire, work permits are hard to get, and many students go home, to a labor market where that expensive foreign degree earns a local wage. Indonesian wages are a small fraction of American ones, so for a student who pays American prices and then flies home to Jakarta, the same degree is not 1.86 years of salary but well over a decade of one. That single fact swamps every ranking above it.
I should be just as careful about the wage I did use. It is the whole economy’s average, not a graduate’s, and that cuts both ways: a fresh graduate usually earns below the average at first, which makes real payback slower, but someone who settles into a career with a master’s typically earns above it, which makes payback faster. Which way it nets is country-specific, so treat these numbers as a rough comparison of value, not a forecast, and not financial advice. Two other things do bias the payback in one clear direction, toward looking too good: the cost counts rent but not food or transport, so it is a floor, and the wages are purchasing-power-adjusted, which flatters lower-income countries like Mexico and Greece. In plain dollars, their payback is even worse than the chart shows.
The sticker is the wrong number
Even after all that, the shape survives, and it is worth carrying. In Indonesia there is a quiet prestige, a gengsi, to an expensive Western degree, as though the price were the point of it. The data says the price is the least informative number in the entire decision. A cheap degree in a low-wage country can be a worse deal than a pricier one in a high-wage country, and the best deals are the unglamorous middle: modest tuition, high wages, a job market that will actually have you.
That lesson reaches well past tuition. Any time you shop on price alone, whether it is a degree or a house, you are using the ruler that is easiest to read rather than the one that measures what you get back. The sticker is the wrong number. Divide it by what you will earn, and the world reorders itself.
Method notes
Data: Kaggle “Cost of International Education” (adilshamim8, 2025). I use the master’s-level programs and take, per country, the median of total cost = tuition over the degree, plus rent (monthly, times twelve, times the duration in years), plus visa and insurance. This is a lower bound on living costs (rent only, not food or transport), applied identically to every country, so cross-country comparison is fair even if the absolute level is understated. A country needs at least three master’s programs to be included, which leaves 27 OECD destinations that also have wage and employment data. Average wages are OECD average annual wages (2024, USD, PPP-adjusted); the employment rate is the OECD working-age (15-64) rate (2024-2025). Payback = total cost divided by the average wage. The caveats do not all point one way. Two make the payback look too good: the cost counts rent but not food or transport (a floor), and the wages are purchasing-power-adjusted (which flatters lower-income countries). The wage is the destination country’s, so this is the stay-and-work case. The denominator is the whole economy’s average wage, not a graduate’s, which cuts both ways: new graduates earn below it, while established degree holders earn above it. The employment rate is economy-wide, not field- or graduate-specific. And the cost figures are a sample of programs, not a census, which adds uncertainty rather than a consistent bias. Code and the external OECD tables are on GitHub: github.com/joechrisnaldy/data-stories.
References
adilshamim8. (2025). Cost of international education [Data set]. Kaggle. https://www.kaggle.com/datasets/adilshamim8/cost-of-international-education
OECD. (2024). Average annual wages [Data set]. OECD Data Explorer. https://www.oecd.org/en/data/indicators/average-annual-wages.html
OECD. (2025). Employment rate [Indicator, ages 15-64]. OECD. https://www.oecd.org/en/data/indicators/employment-rate.html
// About the author
Jonathan Chrisnaldy is a product manager and analyst in New York City, with an M.S. in Technology Management from Columbia University. He writes data stories about the numbers behind everyday claims. More on the experience page or LinkedIn.