· 21 min read · Jonathan Chrisnaldy
Nobody Quit. Nobody Was Unemployed Either.
Every month the world reads two numbers and decides how the job market feels. One of them counts people who left a job even when they walked straight into another one. The other counts only people who are still actively looking, so it loses anyone who gives up. Both numbers are real. Neither measures the thing we use it to measure.
Two numbers decide how the world thinks work is going, and they never arrive together. The unemployment rate comes first, at half past eight in the morning New York time, usually on a Friday early in the month. Markets move on it. Headlines are written from it. Central bankers are asked about it in front of cameras. The quits rate covers the same month but lands three to five weeks later, at ten in the morning, with almost no ceremony at all (U.S. Bureau of Labor Statistics, 2026d, 2026e).
I read them more carefully than I used to, because I am job hunting, and because I built a tool to help me do it. That is my whole stake here, and it is the last time I will mention it.
What follows is about the numbers themselves. Because the two we lean on hardest, the quits rate and the unemployment rate, are both perfectly accurate measurements of something slightly different from what we think they measure.
The number that counts leaving, not losing
Start with the one that gave us a phrase.
In 2021 and 2022, everyone knew what was happening. People were walking out. The Great Resignation had a name, a theory, a small industry of explanation. And it had a number: the quits rate, from the Bureau of Labor Statistics Job Openings and Labor Turnover Survey, known as JOLTS. It rose from about 2.3% of employment per month in 2019 to 3.0% in November 2021, matching a series high it had already touched that September, with what was then a record 4.5 million people quitting in that single month (U.S. Bureau of Labor Statistics, 2022, 2026a).
Now read the definition. A quit, in JOLTS, is an employee who “left voluntarily at any point during the reference month” (U.S. Bureau of Labor Statistics, 2024). There is no condition attached about where they went. JOLTS is a survey of establishments, roughly 21,000 of them, and it counts separations from a payroll. If you resign on Friday and start somewhere else on Monday, your old employer reports a quit and your new one reports a hire. The Federal Reserve Bank of St. Louis says it plainly: the JOLTS data “include employer-to-employer transitions, when workers move from one job to another without being unemployed in between” (Mendez-Carbajo et al., 2025).
So the record-breaking quits rate is a record in leaving jobs. It is not a measure of leaving work.
Two economists, Kathrin Ellieroth of Colby College and Amanda Michaud of the Minneapolis Fed, built the other version. Using the household survey behind the unemployment rate, they measured only the quits that actually end in non-employment, and they did it back to 1978. Their framing is the cleanest summary of this whole essay: the household survey tracks what happens to people, while JOLTS tracks what happens to a job (Ellieroth & Michaud, 2024).
Here is the same period, measured both ways, on one axis.
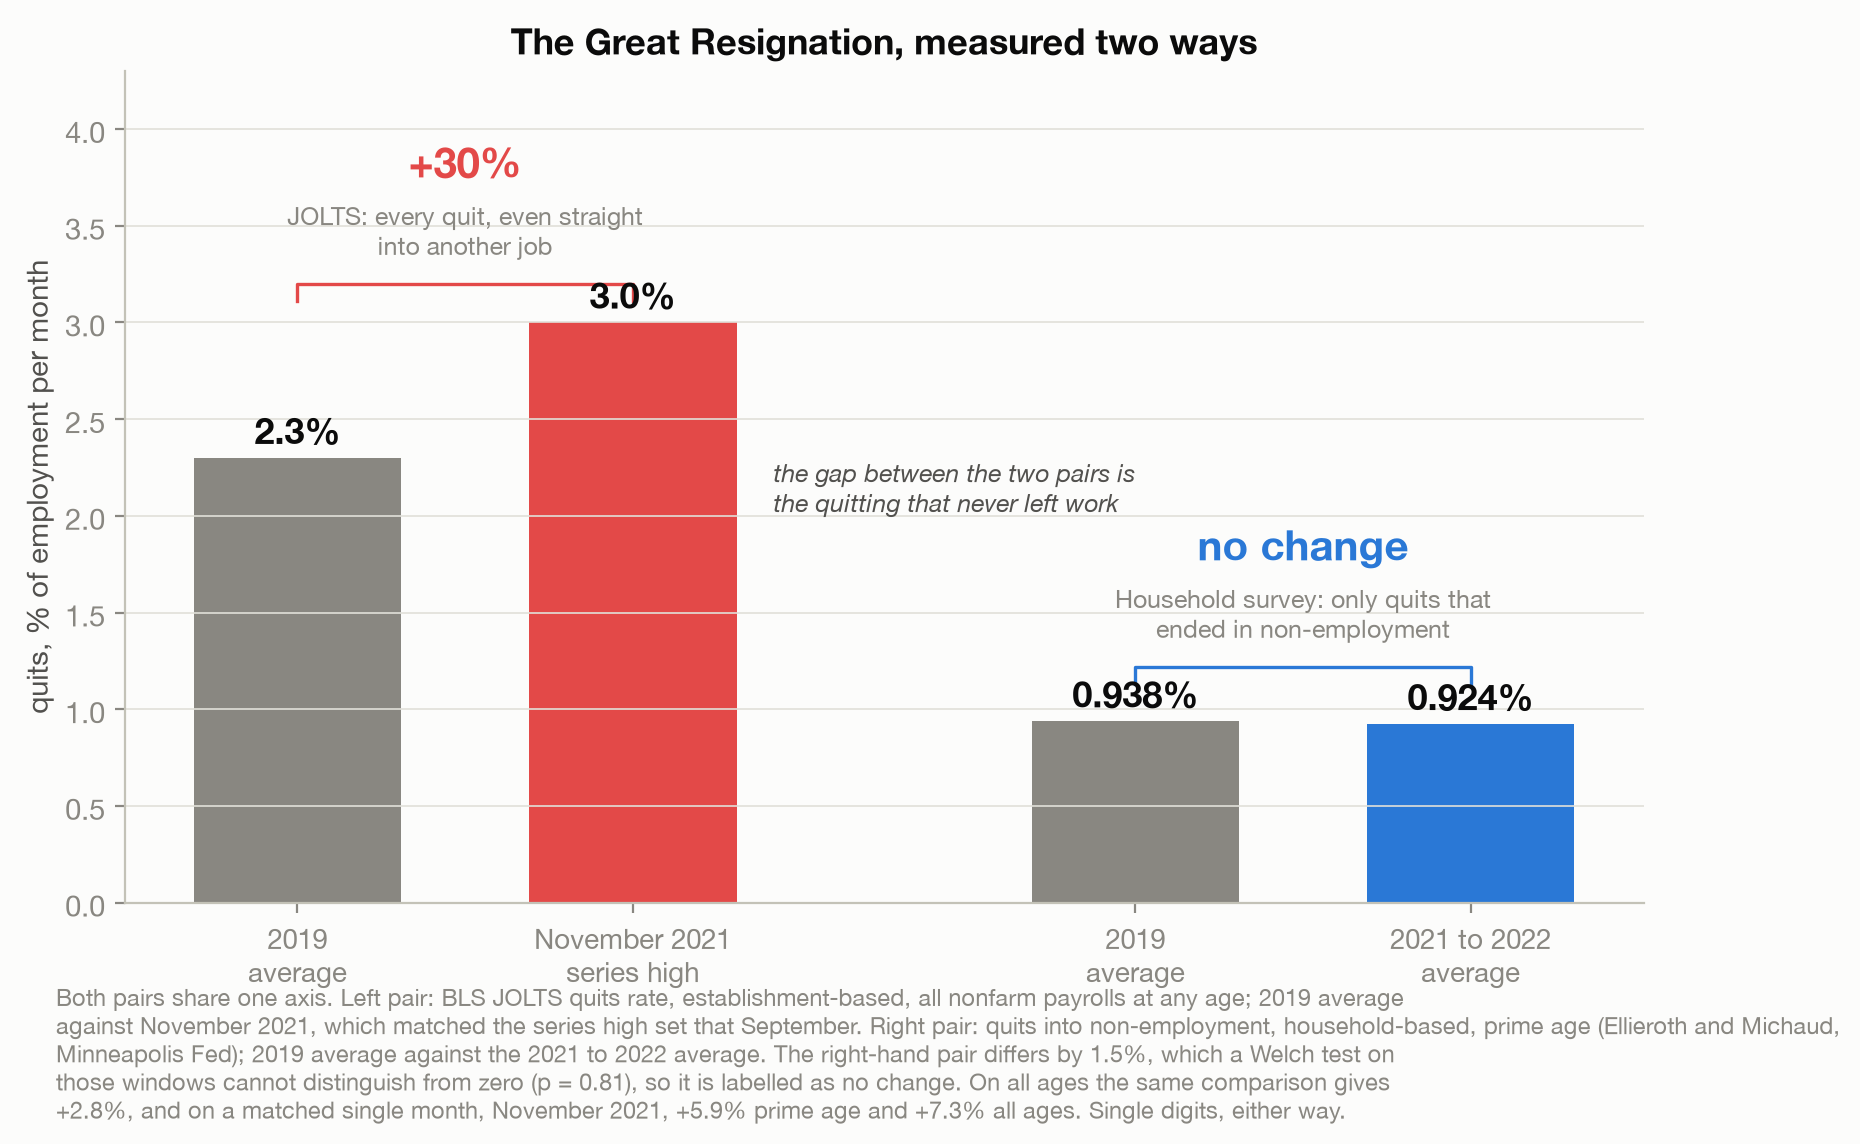
The quits rate everyone quoted rose about 30%. Quitting into non-employment did not follow it anywhere. For prime-age workers it averaged 0.938% of employment per month in 2019 and 0.924% across 2021 and 2022, a gap so small that a test on those two windows cannot tell it apart from zero. Cut it the other ways and the picture holds: on all workers aged 16 and over the same comparison gives a rise of 2.8%, and matching the two measures on the same single month, November 2021, gives 5.9% for prime age and 7.3% for all ages. Single digits at most, against thirty.
So people were not leaving work in appreciably greater numbers, on any of those four cuts. Whatever extra quitting JOLTS recorded, almost none of it ended in non-employment, which leaves moving straight to another job as the only place it can have gone. That is a subtraction rather than a sighting, because neither survey watches a worker walk from one payroll to the next. It was a reshuffle, and we named it a resignation.
None of this is a secret, and the BLS has been saying it for a long time. In 2008, in the BLS’s own Monthly Labor Review, three of its economists and a former colleague at the Philadelphia Fed set out the exact problem. If quits rise in JOLTS, they wrote, “it would be useful to know where these workers went”, and they worked the example: a person who moves from establishment A to establishment B “never became unemployed, so that worker’s status would not change in the CPS data”. Then they set out, thirteen years early, the exact scenario 2021 turned out to be. “It is possible that neither gross flow measure would change, suggesting that those who quit found new jobs quickly and remained in the pool of employed persons” (Boon et al., 2008).
The caveat was never missing. It was published, with a worked example, long before anyone needed it. We just did not look, because the number was going up and we had a story that fit.
What the long view shows instead
Once you look at separations that actually end in non-employment, the shape of the labour market changes.
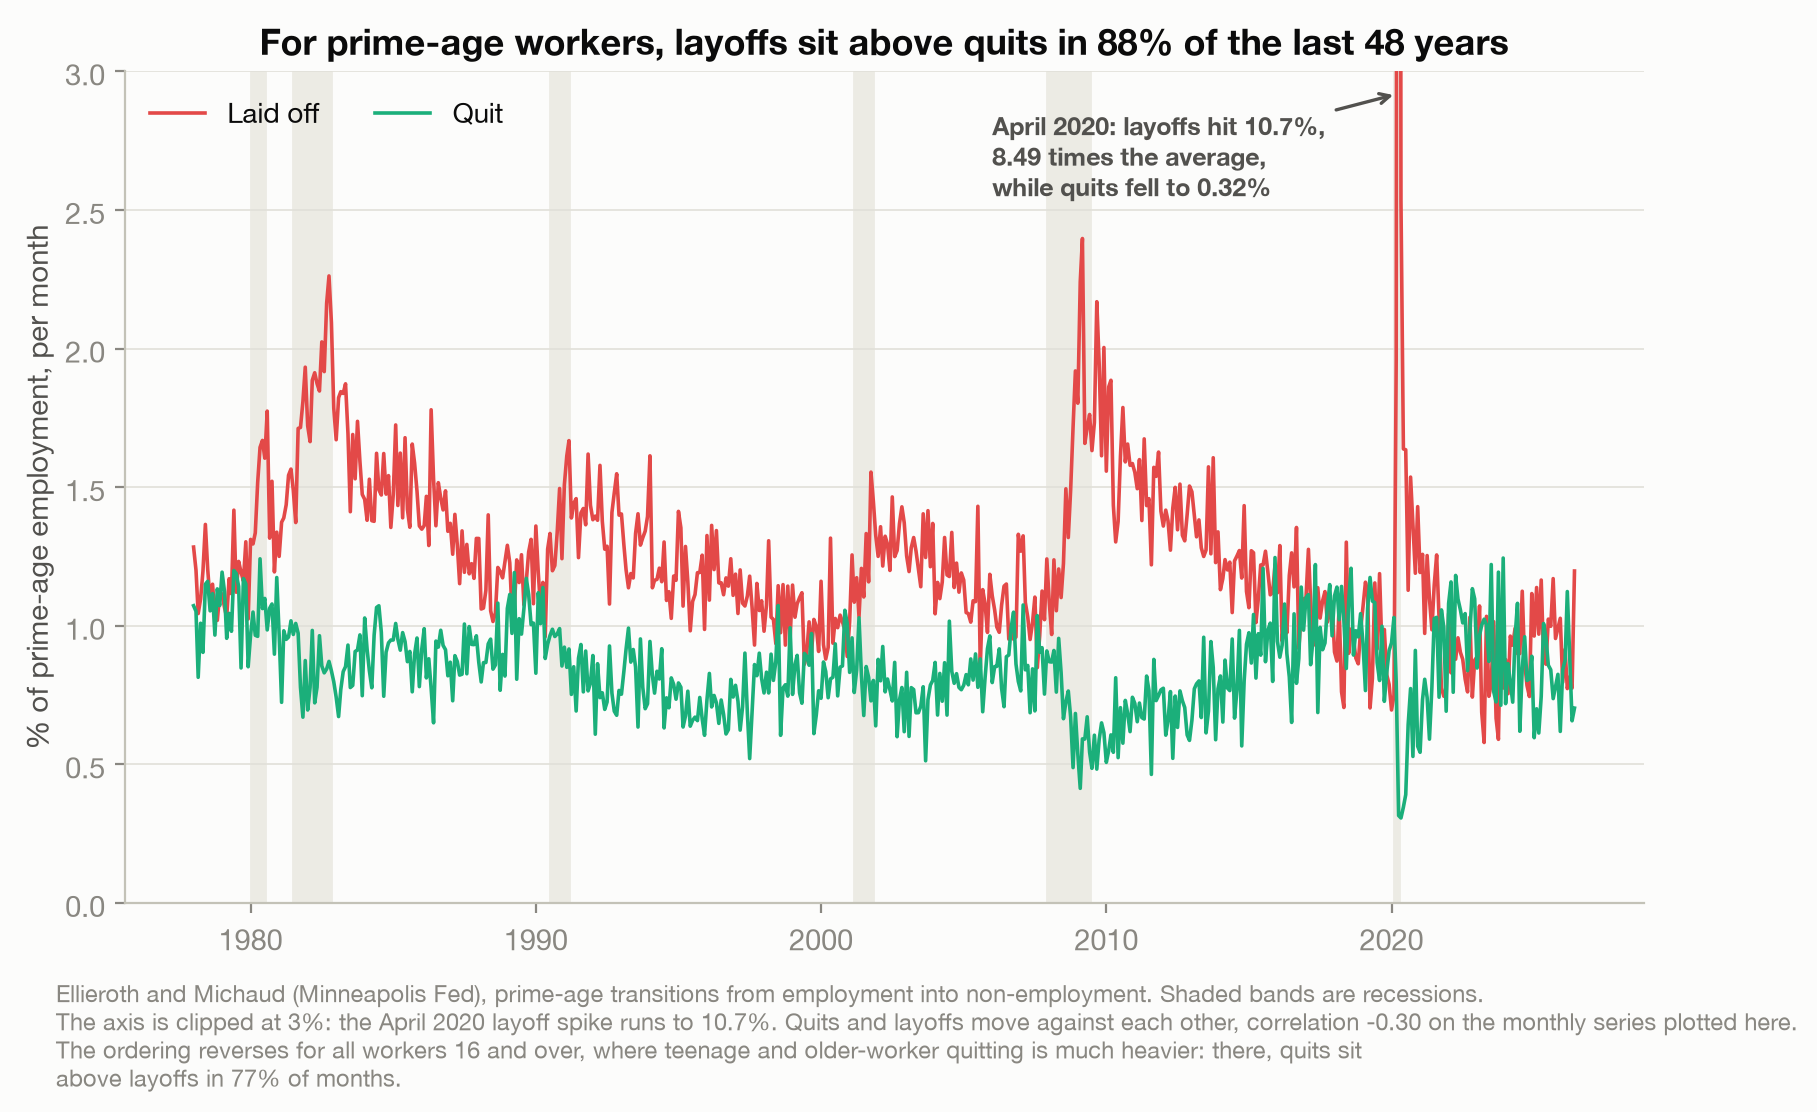
Across 582 months, layoffs sat above quits for prime-age workers in 514 of them, 88% of the time. The two move against each other, with a correlation of about -0.30 month by month across those years. Ellieroth and Michaud report -0.46 for the same relationship; their series are smoothed with a six-month centred moving average and stop at the end of 2024, which is the same fact with the monthly noise taken out (2026a). When work is plentiful people quit and are not let go; when it is scarce the reverse. April 2020 is the extreme case in both directions at once: prime-age layoffs reached 10.7% of employment in a single month, 8.49 times the 48-year average, while quitting collapsed from 1.03% in February to 0.32%. Nobody resigns during a panic.
That ordering is specific to prime age. Take all workers aged 16 and over, where teenage and older-worker quitting is far heavier, and it flips: quits sit above layoffs in 77% of the same months, and the see-saw between the two weakens by half, to about -0.15. Which measure you look at decides which story you see, before anyone has interpreted anything.
Right now the prime-age pattern is unusually flat. Quits into non-employment have run at 0.81% of prime-age employment over the last twelve months, below both 2019 and the supposed resignation years. The JOLTS quits rate is 1.9%, more than a third below the 3.0% it reached in 2021 (U.S. Bureau of Labor Statistics, 2026b). Chair Powell called this “a low-firing, low-hiring environment” in September 2025, and returned to it in April 2026 as “an unusual and uncomfortable kind of a balance where people who don’t have jobs will have a hard time breaking in unless somebody quits their job” (Board of Governors of the Federal Reserve System, 2025, 2026a).
The number that loses people
Now the second one, and this is the half that matters more.
To be counted as unemployed by the BLS you must satisfy three conditions: you have no job, you are available for work, and you have actively looked for work in the previous four weeks (U.S. Bureau of Labor Statistics, 2015). Reading listings does not count. Neither does giving up. There is one exception, and it matters later: workers expecting to be recalled from a temporary layoff are counted as unemployed whether or not they have looked.
Stop searching, that exception aside, and you are not unemployed. You are “not in the labour force”, which is the same category as retirees and full-time students and people who have never wanted a job at all.
So consider what happens to someone who is laid off. They can look for work, in which case the unemployment rate counts them. Or they can stop, in which case it does not. The Ellieroth and Michaud data measures exactly this split, and the answer is not small.
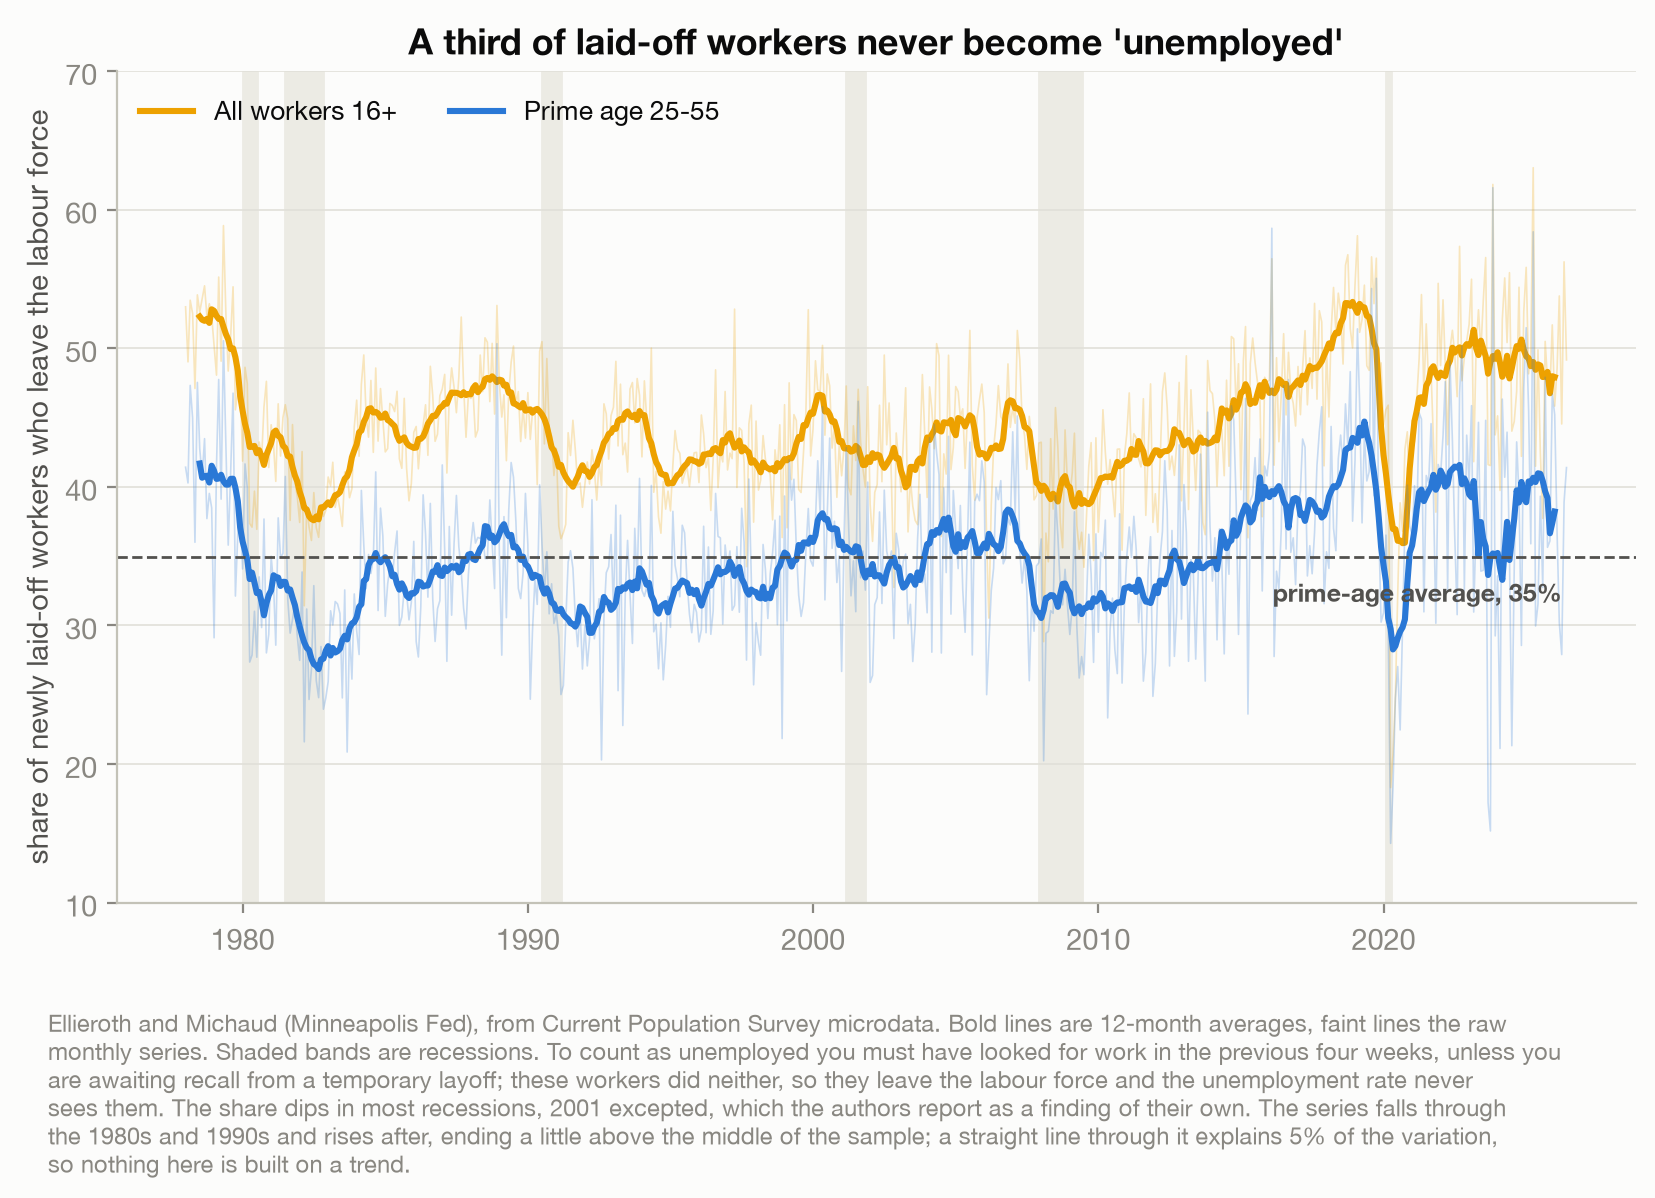
On average across 48 years, 35% of newly laid-off prime-age workers left the labour force rather than becoming unemployed. For all workers aged 16 and over it is 44.5%. Among people who quit into non-employment the share is higher still: 85% of prime-age quitters go to non-participation rather than to unemployment.
The published alternatives tell the same story from the other end. In June 2026 the headline unemployment rate was 4.2%. Add discouraged workers and it is 4.5%. Add everyone else marginally attached to the labour force and it is 5.2%. Add people working part time who want full time and it is 7.9% (U.S. Bureau of Labor Statistics, 2026c). Each step puts the added people into the denominator as well as the numerator, which is why the increments look smaller than they are.
And 6.0 million people were outside the labour force in June and said they currently wanted a job. About 1.8 million of them wanted work, were available for it, and had looked sometime in the past year but not in the last four weeks, which is exactly what puts them inside those broader measures and outside the headline one. Of that 1.8 million, some 477,000 had given up specifically because they believed no work was available. The remaining four million and change sit outside every published unemployment rate, including the broadest.
The month it happened in public
If you want to watch the mechanism work, look at the report for June 2026.
The labour force shrank by 720,000 people. The number of people not in the labour force rose by 832,000. Participation fell to 61.5%. And the unemployment rate improved, from 4.3% to 4.2% (U.S. Bureau of Labor Statistics, 2026c).
Nothing was falsified. Every one of those numbers is correct. But the mechanism is not the one that paragraph seems to imply, and it is worth being exact, because the exact version is worse.
A shrinking labour force, on its own, pushes the unemployment rate up rather than down: the same job seekers divided by a smaller total. The labour force did shrink, by 720,000, and on its own that would have nudged the rate up by about two hundredths of a point. It fell anyway, because the count of unemployed people dropped faster, by 213,000. The improvement came from the top of the fraction, not the bottom.
The count of employed people dropped too, by 507,000. So in the same month the number of people working went down, the number of people counted as looking went down, and the number of people outside the labour force went up by 832,000. Push all 720,000 who left the labour force back in as job seekers and June prints 4.6% instead of 4.2%. That is an upper bound rather than a measurement, because a net fall in employment can also mean that hiring simply stopped. But it is the size of the space the headline number does not cover.
That is not a freak month either. The BLS publishes these flows as three-month moving averages, and for December 2024 they ran like this: of everyone who had been unemployed a month earlier, 23.7% had found work, 22.4% had stopped looking and left the labour force, and 53.9% were still unemployed (Sok et al., 2025). Almost exactly as many people left the statistic by giving up as by succeeding.
There is a corroborating oddity in the current data. The Richmond Fed points out that January 2026’s hiring rate of 3.3% would historically have implied an unemployment rate somewhere between 6 and 10 percent. The actual rate was 4.3% (O’Trakoun, 2026). Hiring collapsed and the headline number barely moved. Part of that is the low-firing half of Powell’s phrase: if few people are being let go, the count stays small whatever hiring does. But low firing does not explain the 507,000 who left employment in June, and the remainder is what you would expect if a share of the people who lose work never enter the count at all.
Where the laid-off actually go
The split is not constant, and the way it moves is counterintuitive enough to be worth stating carefully.
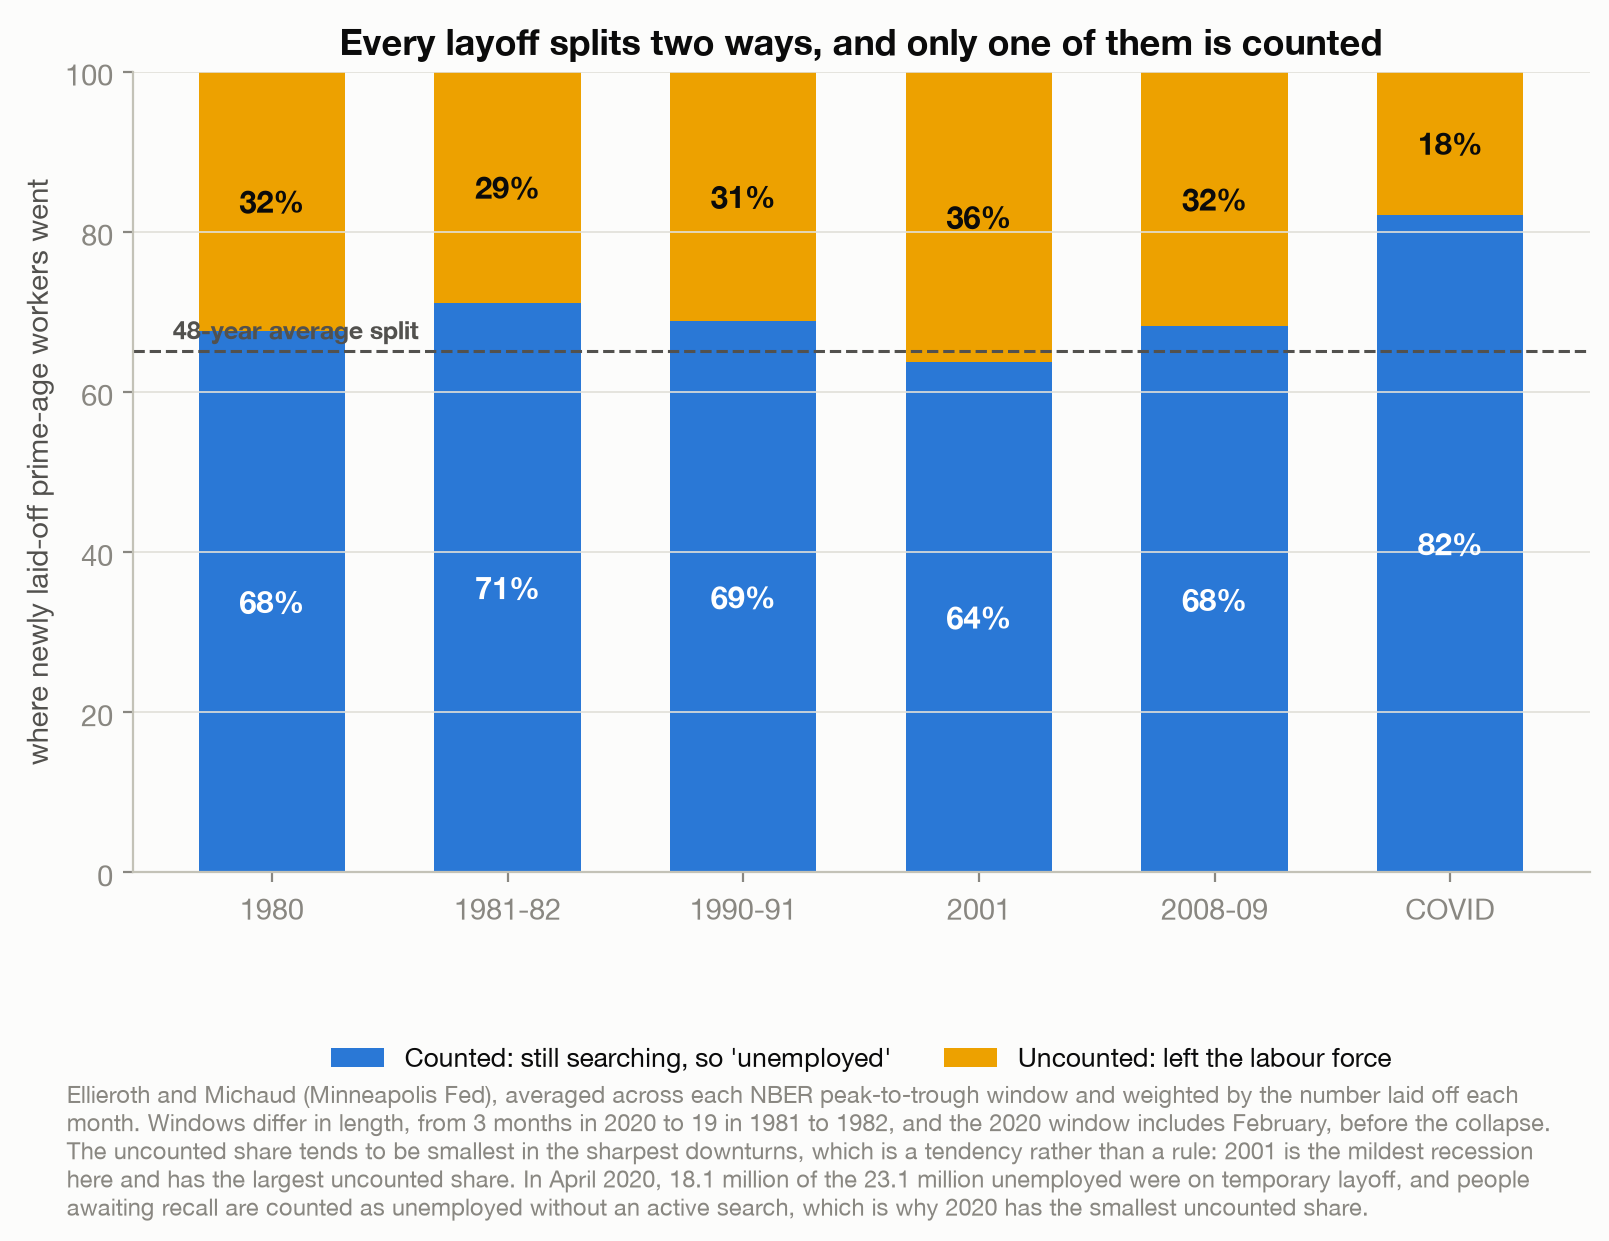
The uncounted share tends to be smallest in the sharpest downturns. Across the window that spans the collapse of spring 2020, February included, 82% of laid-off prime-age workers stayed in the labour force and were counted, and in April alone it was 86%. That is the opposite of the intuitive picture, and for that episode the reason is mechanical: 18.1 million of the 23.1 million people unemployed that April were on temporary layoff, and people expecting recall are counted without having to search (U.S. Bureau of Labor Statistics, 2015, 2020).
It is a tendency rather than a rule. The 2001 recession is the mildest of the six here and has the largest uncounted share of all of them. But the pattern is not only a 2020 artefact: Ellieroth and Michaud document it across the sample, finding that laid-off workers are more likely to stay attached to the labour force when unemployment is rising (Ellieroth & Michaud, 2026a).
Which means the share that disappears is largest in ordinary times. Not in the crash, when we are all watching, but in the long flat stretches afterwards, when a person stops answering listings and quietly leaves the arithmetic. Be careful with that sentence, though, because it is about the share and not the count. In a recession more people vanish outright, simply because there are far more layoffs. It is the fraction of them who stop looking that falls.
One more thing this reframes. Ellieroth and Michaud find that layoffs are about 20% more common than the standard employment-to-unemployment flow suggests, and that quits are about 45% less common than the employment-to-non-participation flow suggests, on their finding that 40% of what looks like people drifting out of the labour force is actually people being let go (Ellieroth & Michaud, 2026a). Some of what we file under lifestyle choice is job loss wearing different clothes.
What a number counts, and who it loses
None of this is a scandal, and none of it means the statistics are wrong. The unemployment rate measures precisely what it says it measures: people without work who are actively looking for it. The quits rate measures precisely what it says: separations initiated by employees. Both are carefully built by serious people, and the BLS publishes the alternatives, the definitions, and the flows for anyone who wants them.
The gap is between what the numbers define and what we do with them. We take a measure of job-switching and read it as a measure of how fed up workers are. We take a measure of active search and read it as a measure of how many people have been left behind. The definitions never moved. Our reading of them did.
So the next time a labour-market number moves a market or a headline, before you decide what it says about the country, ask the two questions this data answers. What is it actually counting? And who does it lose the moment they stop trying?
Method notes
The panel is QLmonthly, monthly quit and layoff transition rates built from Current Population Survey microdata by Kathrin Ellieroth and Amanda Michaud and published by the Federal Reserve Bank of Minneapolis: 582 monthly rows, January 1978 to June 2026 (Ellieroth & Michaud, 2026b). Every figure attributed to it here is recomputed from the source files, which are on GitHub and on FRED as release 738. The series measures transitions from employment into non-employment only, which is exactly why it differs from JOLTS. “Prime age” follows the authors, who define it as 25 to 55. The panel passed the checks I run on any dataset: every recession appears with a plausible magnitude, and April 2020 is unmistakable at 8.49 times the average layoff rate with quits collapsing in the same month.
One gap in that panel is worth naming. The BLS did not collect the household survey for the October 2025 reference period, because of a lapse in appropriations, and will not collect it retroactively (U.S. Bureau of Labor Statistics, 2026f). The panel nonetheless carries values for October and November 2025, and the project does not document how it produced them. I have not been able to establish it. The only figure in this piece that depends on those two rows is the twelve-month average of 0.81%, which becomes 0.81% if you drop them both, so nothing here turns on it.
Everything not from that panel is a verified external figure held as a named constant with its source recorded. JOLTS definitions and rates, the unemployment definition, the U-1 through U-6 alternatives, the April 2020 and June 2026 reports and the release schedules are BLS. The flows out of unemployment are from the BLS Monthly Labor Review. The hiring-rate comparison is the Richmond Fed. Fed quotations are attributed to the chair who said them: Powell in September 2025 and April 2026, with Kevin Warsh sworn in as chair on May 22, 2026 and therefore chairing by June (Board of Governors of the Federal Reserve System, 2026b).
Three caveats about the comparisons. The first chart puts JOLTS and the household series on one axis, which is honest about the level gap but not a like-for-like match of populations: JOLTS is establishment-based and counts separations from nonfarm payrolls at any age, while the household series is reported here for prime age. That is why the essay checks the contrast on all ages and on a matched single month as well, and reports all four. Second, the two sides also use different comparison points, a single record month for JOLTS against a two-year average for the household series, which is why the matched-month version is given alongside it. Third, the share of laid-off workers leaving the labour force falls through the 1980s and 1990s and rises after, ending a little above the middle of the sample; a straight line through it explains about 5% of the variation, and Ellieroth and Michaud read the early and late periods as broadly stable, so I have built nothing on the difference.
On artificial intelligence, which is the explanation currently attached to every layoff story: Challenger, Gray and Christmas reports that AI was cited in about 101,700 of the 443,600 job cuts announced in the first half of 2026 (Challenger, Gray & Christmas, 2026). Those are announcements, not measured separations, and they are not the same kind of object as anything else in this piece. The best available assessment of the measured data, from the Budget Lab at Yale, is that no clear labour-market effect of AI was detectable in the evidence available when they published in May 2026 (Nunn, 2026). I have therefore not made an argument about it, in either direction.
The analysis code and data notes are on GitHub.
References
Board of Governors of the Federal Reserve System. (2025, September 17). Transcript of Chair Powell’s press conference. https://www.federalreserve.gov/mediacenter/files/FOMCpresconf20250917.pdf
Board of Governors of the Federal Reserve System. (2026a, April 29). Transcript of Chair Powell’s press conference. https://www.federalreserve.gov/mediacenter/files/FOMCpresconf20260429.pdf
Board of Governors of the Federal Reserve System. (2026b, May 22). Kevin Warsh takes oath of office as chairman and a member of the Board of Governors of the Federal Reserve System, and the Federal Open Market Committee unanimously selects Warsh as its chairman. https://www.federalreserve.gov/newsevents/pressreleases/other20260522a.htm
Boon, Z., Carson, C. M., Faberman, R. J., & Ilg, R. E. (2008). Studying the labor market using BLS labor dynamics data. Monthly Labor Review, 131(2), 3-16. https://www.bls.gov/opub/mlr/2008/02/art1full.pdf
Challenger, Gray & Christmas. (2026, July 1). Challenger report: June layoffs cool to 45,849, down 53% from May; AI leads reasons for fourth consecutive month. https://www.challengergray.com/blog/challenger-report-june-layoffs-cool-to-45849-down-53-from-may-ai-leads-reasons-for-fourth-consecutive-month/
Ellieroth, K., & Michaud, A. (2024, November 19). Where is the U.S. labor market heading? Interpreting the mixed signals. Federal Reserve Bank of Minneapolis. https://www.minneapolisfed.org/article/2024/where-is-the-us-labor-market-heading-interpreting-the-mixed-signals
Ellieroth, K., & Michaud, A. (2026a). Quits, layoffs, and labor supply (Institute Working Paper No. 94, rev. January 2026). Federal Reserve Bank of Minneapolis, Opportunity & Inclusive Growth Institute. https://doi.org/10.21034/iwp.94
Ellieroth, K., & Michaud, A. (2026b). QL Monthly: Quits and layoffs monthly [Data set]. https://sites.google.com/qlmonthly.com/home
Mendez-Carbajo, D., Ellieroth, K., & Michaud, A. (2025, June 26). Data on quits and layoffs. FRED Blog, Federal Reserve Bank of St. Louis. https://fredblog.stlouisfed.org/2025/06/data-on-quits-and-layoffs/
Nunn, R. (2026, May 7). AI is probably not (yet) the reason for labor market weakening. The Budget Lab at Yale. https://budgetlab.yale.edu/research/ai-probably-not-yet-reason-labor-market-weakening
O’Trakoun, J. (2026, March 24). A JOLTing labor market situation? Federal Reserve Bank of Richmond, Macro Minute. https://www.richmondfed.org/research/national_economy/macro_minute/2026/jolting_labor_market_situation
Sok, E., Smith, S., & Evans, J. (2025, September). Unemployment rate increases in the first half of 2024, before leveling off, while the labor force participation rate holds fairly steady. Monthly Labor Review. U.S. Bureau of Labor Statistics. https://doi.org/10.21916/mlr.2025.17
U.S. Bureau of Labor Statistics. (2015, October 8). How the government measures unemployment. Current Population Survey. https://www.bls.gov/cps/cps_htgm.htm
U.S. Bureau of Labor Statistics. (2020, May 8). The employment situation: April 2020 (USDL-20-0815). U.S. Department of Labor. https://www.bls.gov/news.release/archives/empsit_05082020.htm
U.S. Bureau of Labor Statistics. (2022, January 4). Job openings and labor turnover: November 2021 (USDL-22-0001). U.S. Department of Labor. https://www.bls.gov/news.release/archives/jolts_01042022.htm
U.S. Bureau of Labor Statistics. (2024, December 4). JOLTS frequently asked questions. U.S. Department of Labor. https://www.bls.gov/jlt/jltfaq.htm
U.S. Bureau of Labor Statistics. (2026a). Total nonfarm quits rate and level, seasonally adjusted [Data series JTS000000000000000QUR and JTS000000000000000QUL]. Job Openings and Labor Turnover Survey, U.S. Department of Labor. Retrieved July 29, 2026, from https://data.bls.gov/timeseries/JTS000000000000000QUR
U.S. Bureau of Labor Statistics. (2026b, June 30). Job openings and labor turnover: May 2026 (USDL-26-1123). U.S. Department of Labor. https://www.bls.gov/news.release/archives/jolts_06302026.htm
U.S. Bureau of Labor Statistics. (2026c, July 2). The employment situation: June 2026 (USDL-26-1125). U.S. Department of Labor. https://www.bls.gov/news.release/archives/empsit_07022026.htm
U.S. Bureau of Labor Statistics. (2026d). Schedule of releases for the employment situation. U.S. Department of Labor. Retrieved July 29, 2026, from https://www.bls.gov/schedule/news_release/empsit.htm
U.S. Bureau of Labor Statistics. (2026e). Schedule of releases for the job openings and labor turnover survey. U.S. Department of Labor. Retrieved July 29, 2026, from https://www.bls.gov/schedule/news_release/jolts.htm
U.S. Bureau of Labor Statistics. (2026f). 2025 federal government shutdown impact on the Current Population Survey. U.S. Department of Labor. Retrieved July 29, 2026, from https://www.bls.gov/cps/methods/2025-federal-government-shutdown-impact-cps.htm
// About the author
Jonathan Chrisnaldy is a product manager and analyst in New York City, with an M.S. in Technology Management from Columbia University. He writes data stories about the numbers behind everyday claims. More on the experience page or LinkedIn.