· 22 min read · Jonathan Chrisnaldy
A Third of the World's Labour Laws Still Assume You Work Saturday
Forty hours is five eight-hour days. Forty-eight is six, and in 2012 a third of the countries with a working-hours law still legislated one. The world's labour codes agreed most closely in 1949 and have drifted apart ever since, and the number that standardised turns out not to be the number that sets the outer limit.
Forty hours is five eight-hour days. Forty-eight hours is six.
That is the whole of the arithmetic, and it is worth sitting with, because in 2012 there were 168 countries with a law setting a normal working week, and 56 of them had set it at 48. You cannot fit 48 hours into five days at eight hours a day. You would need 9.6. So a statute that says 48 is a statute built around a sixth working day, and a third of the countries that legislate a working week still have one.
I did not go looking for that. I went looking for a story about convergence, because the dataset I was reading, which I found through Data Is Plural (Singer-Vine, 2021), is famous for one. I found something more interesting than the story I expected.
The dataset
Magnus Bergli Rasmussen hand-coded working-time laws year by year back to 1789, for 221 polities on normal hours, and released a public file restricted to the polities the Varieties of Democracy project gives codes to. He puts that restriction at 197; the file as distributed carries 202 country identifiers and 27,192 country-years, and you can download it as a Stata file without asking anyone (Rasmussen, n.d.). What existed, what the normal week was, what the maximum was, what overtime paid.
He calls it “unparalleled in scope”, on the grounds that it covers “more polities over a longer time than alternative datasets” (Rasmussen, 2024), and comparable datasets do exist: the Cambridge CBR Labour Regulation Index covers 117 countries from 1970. But the difference that matters here is not size. Most working-hours data measures hours worked. This measures what the statute said. His paper on it is called “The Great Standardisation”, and the title is the argument: working hours became globally standardised through public policy.
Two things about the file before any of it means anything, because both will hand you a false headline.
The column for normal weekly hours contains the value 96 for 14,824 rows, which is 55% of the rows where it is populated at all. Those 14,824 rows are exactly, with zero exceptions, the rows where no working-hours law existed. 96 is a placeholder. Average the column as it comes and you get 73.4 hours, a figure that is neither a legal ceiling nor a placeholder but a blend of the two.
The second thing: the file runs to 2020, but in 2013 seventy countries lose their maximum-hours value and sixty-one of those with a working-hours law drop from a positive overtime premium to exactly zero, while not one changes its normal week. In no earlier year does more than a single country make that move. That is not history, that is where the coding stops. Everything below ends in 2012.
The convergence is mostly the placeholder
The paper measures its standardisation as the standard deviation of normal hours falling from 23.68 in 1940 to 9.64 in 2010 (Rasmussen, 2024, Table 3). I could not make that table reproduce, so I kept trying, and the reason is instructive. In 1940 every country with a law sat between 40 and 60 hours, and the widest a variable bounded there can possibly be is 10. A standard deviation of 23.68 is not achievable. It only appears when the unregulated countries are included at 96.
Include them and the table reproduces to a maximum absolute error of 0.032 across all thirteen published years. Compute it on the countries that actually had a law and it does not reproduce at all: it goes 4.68 in 1940, down to 2.96 in 1950, and back up to 3.99 in 2010.
The table’s caption reads “for countries regulating working time”, which is the computation that does not reproduce. That phrasing is what sent me looking. Elsewhere in the paper the law-havers really are law-havers: Figures 2, 5b and 6b are all explicitly on countries regulating hours. Table 3 is the odd one out.
Treating an unregulated week as 96 hours is a defensible choice, and on that choice the falling number measures something real: the world converging as regulation spreads. That is his thesis and the thesis is sound. But it answers a different question from the one it looks like it answers. “Countries agree more about working hours” and “more countries have working-hours laws” are not the same sentence, and across the naive mean series, which falls from 86.8 hours in 1920 to 46.4 in 2012, 90.6% of that fall is the second one, anywhere between 84.5% and 96.7% depending on how you order the decomposition.
So every hours figure from here is computed only on countries that had a law.
Agreement peaked, and then it reversed
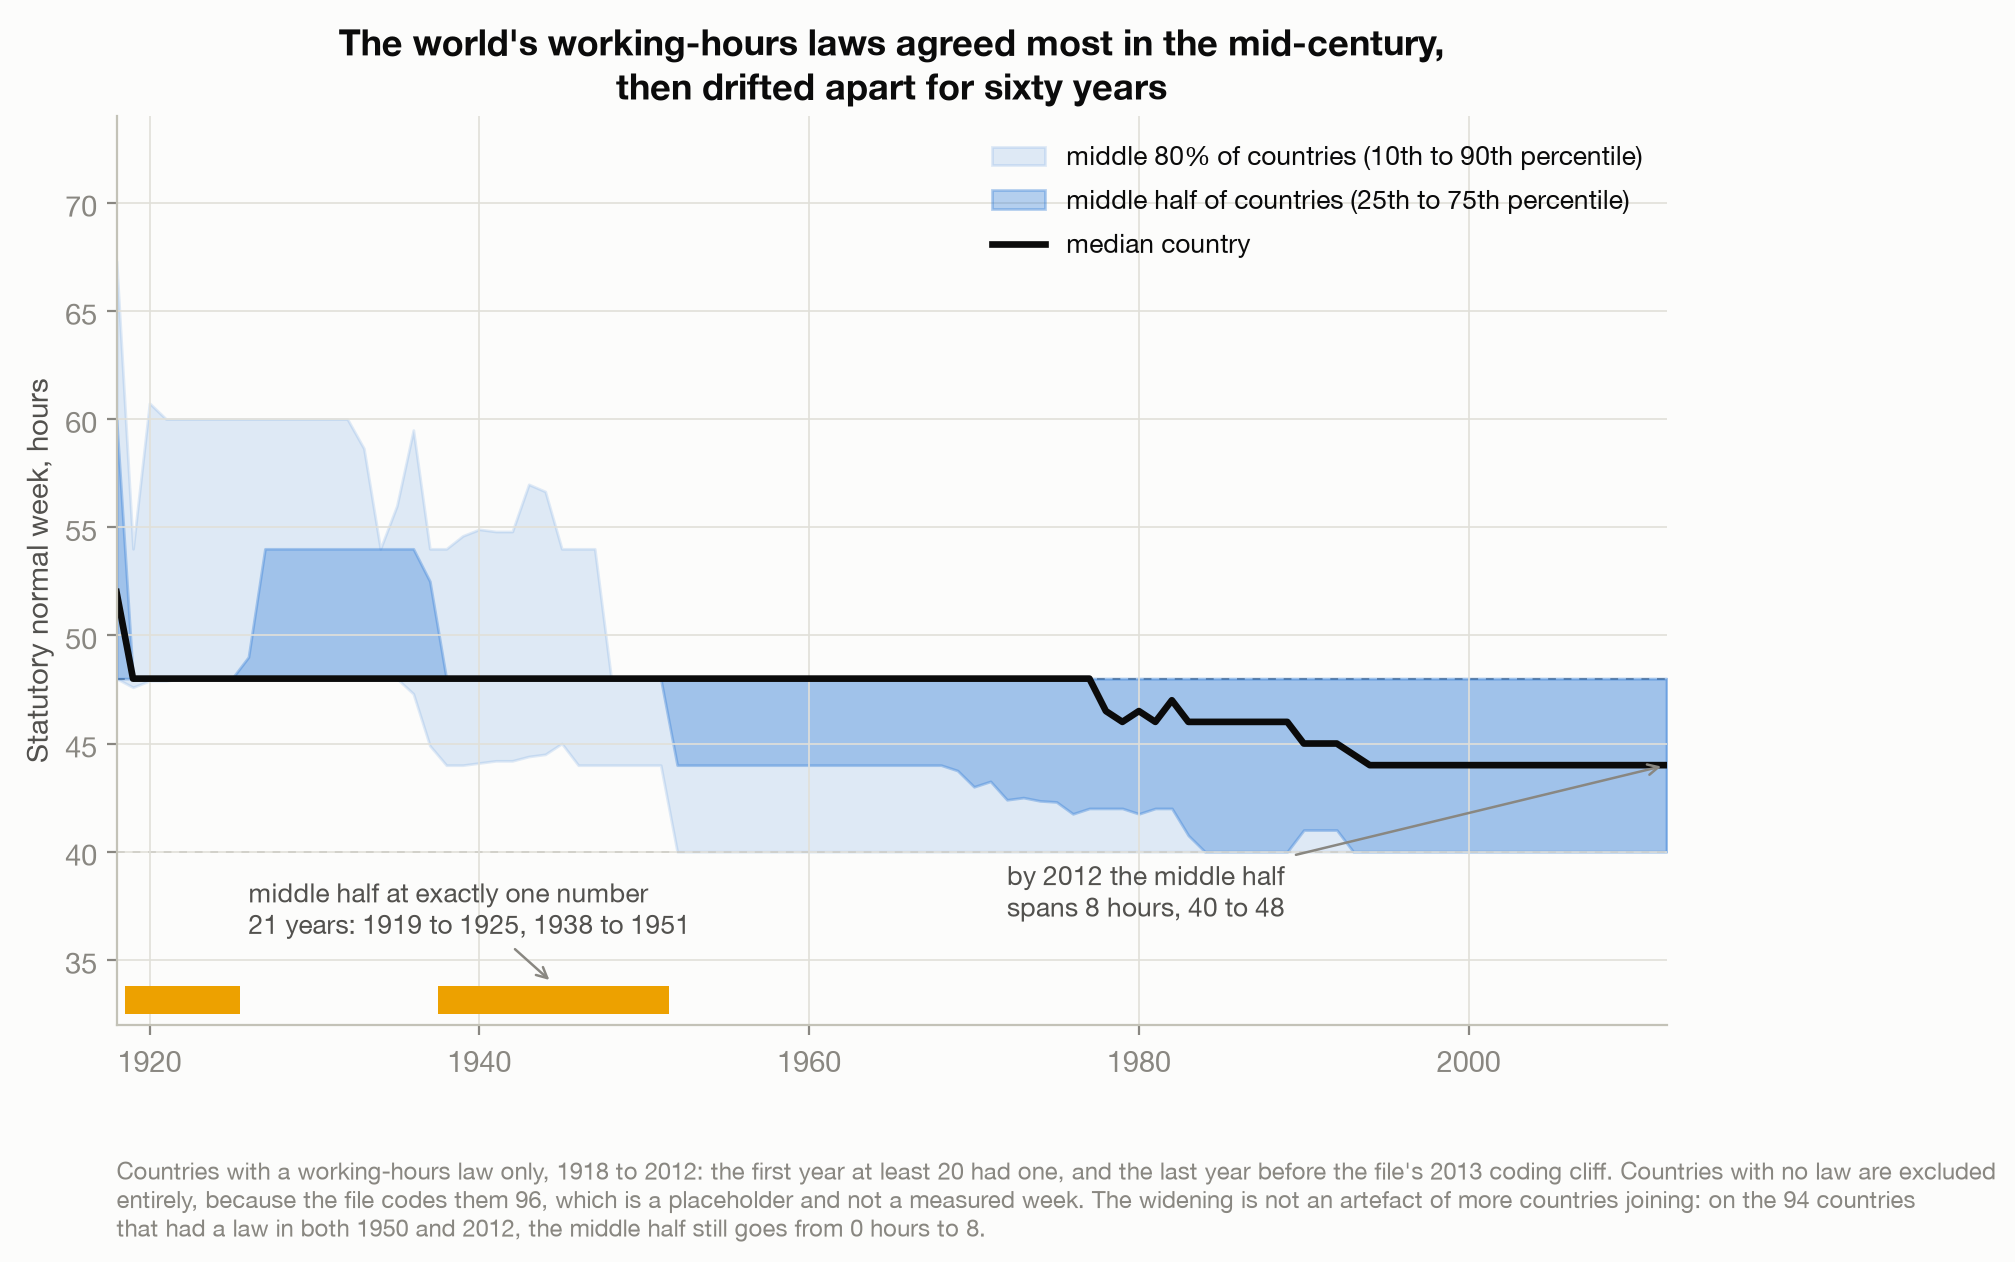
For 21 years, in two stretches running 1919 to 1925 and 1938 to 1951, the middle half of every legislating country on earth sat at exactly the same number. The interquartile range was zero. Not close to zero. Zero. Half the world’s labour codes agreed on a figure to the hour.
The tightest years were 1949 and 1950, which are identical in this file to the row: the spread across the 97 countries with a law was 6.22% of the mean. No year since 1951 has come close. The best in sixty years is 1967, at 7.13%. By 2012 it is 9.16%, and the middle half spans eight hours, from 40 to 48.
The obvious objection is that this is arithmetic on a growing set: 97 countries had a law in 1950 and 168 did in 2012, and adding countries can widen a spread without anything changing. So I checked it on the 94 countries that had a law in both years. Their standard deviation still rises, 2.99 to 3.82, and their relative spread still rises, 6.29% to 8.82%. Take a later baseline that is not sitting at the historical floor and it still holds: on the 110 countries with a law in both 1960 and 2012, the spread widens too. Measured from the peak, the widening is not composition.
And notice what the headline number was doing throughout. The mean statutory week fell in every single decade from the 1920s to the 2010s, 50.5 hours to 43.7, without one reversal. The median is even less revealing: it sat at exactly 48 for 59 years, from 1919 to 1977, then took another seventeen years and nine separate moves, two of them upward, to settle at 44 in 1994. Anyone tracking either number saw a world improving or standing still, and had no reason to look at the spread. The convergence ended under cover of the average still moving.
The world never agreed on one number
I had assumed the spread was widening because countries were fanning out along a range. They are not. They are piling up on two values.
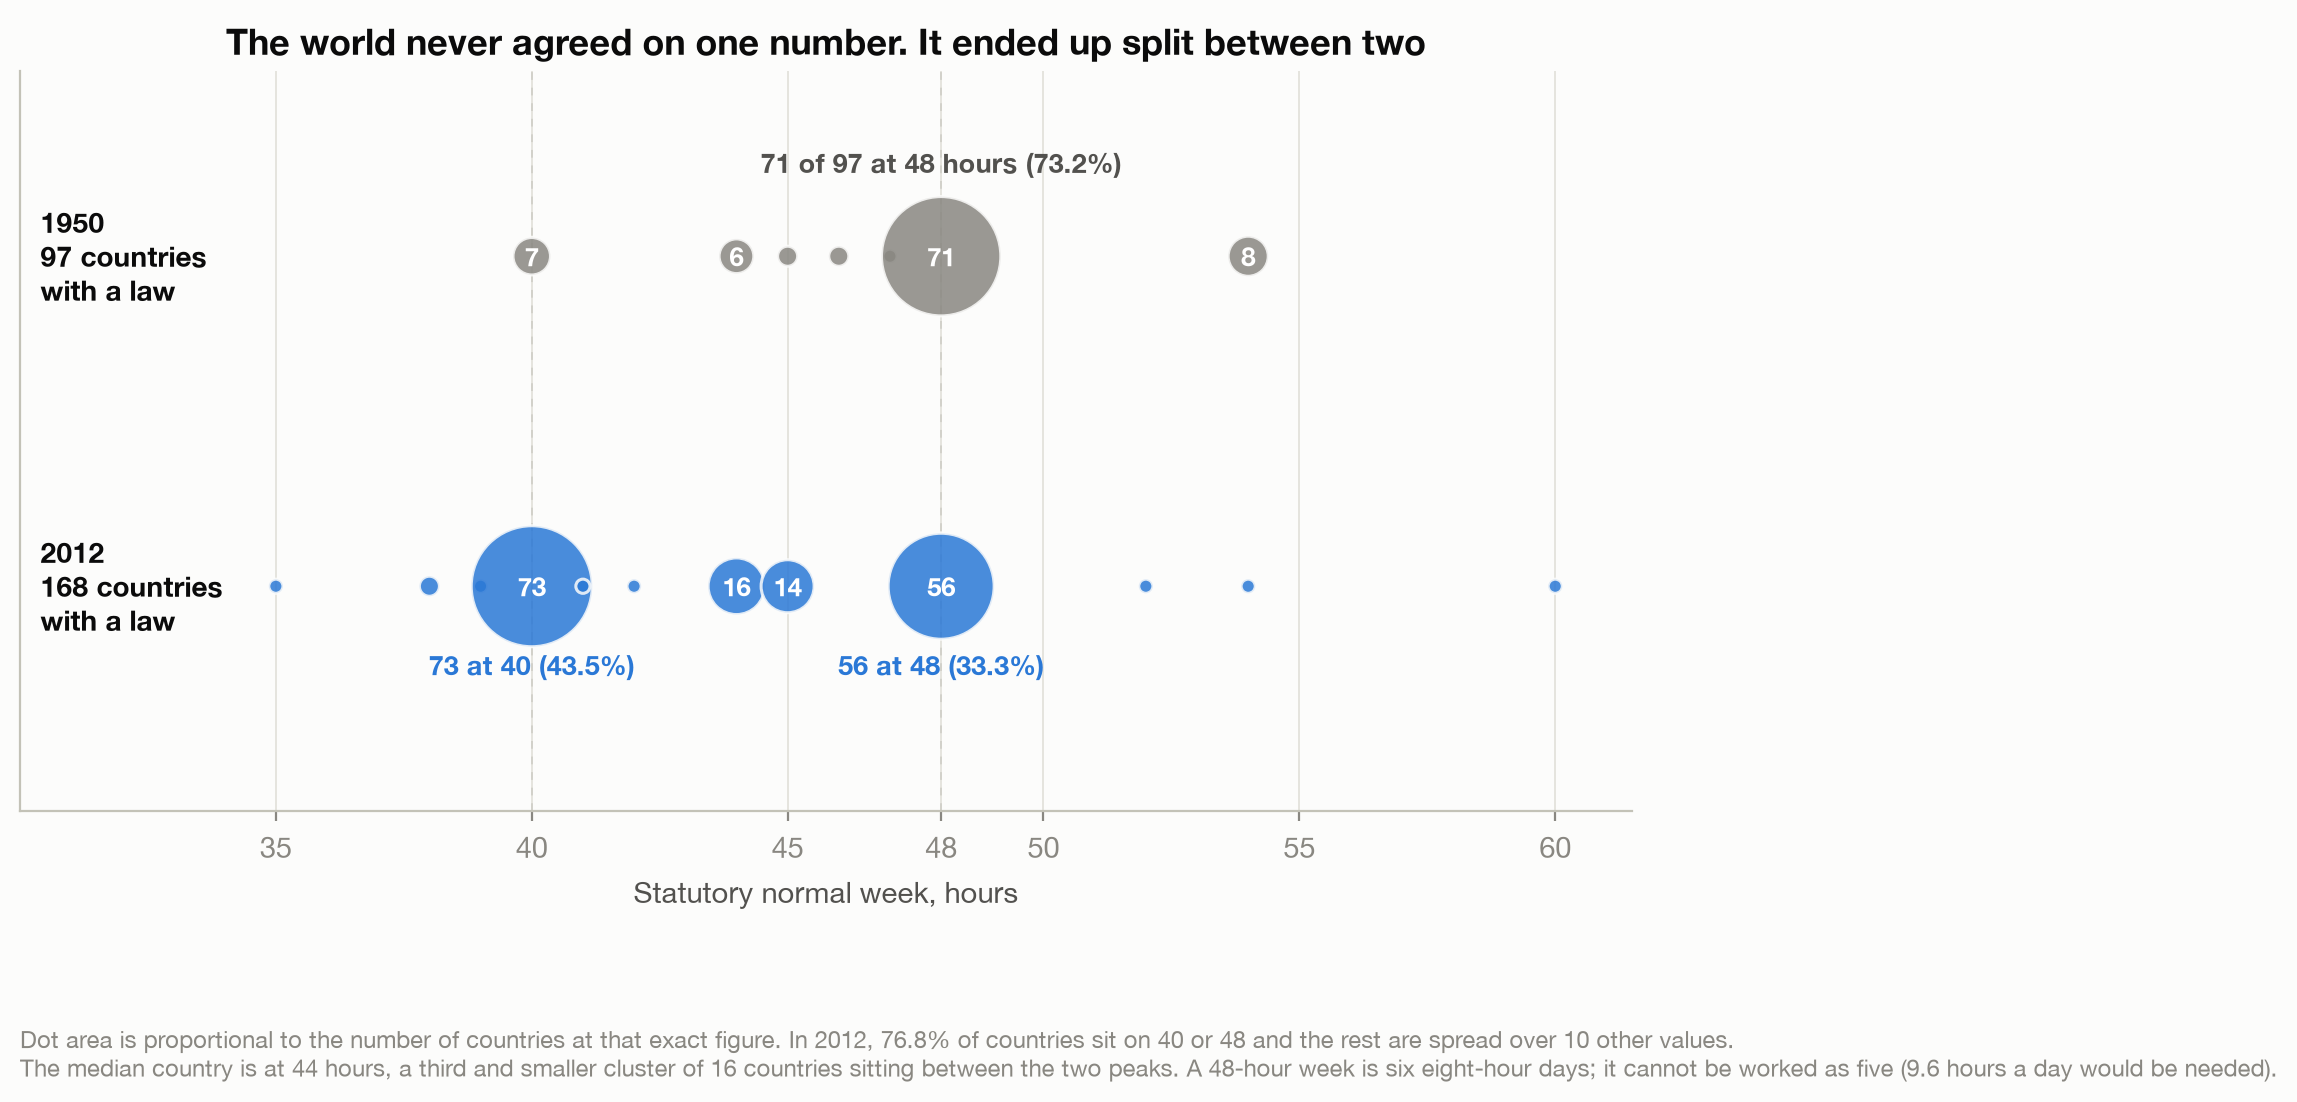
In 1950, 71 of 97 countries were at 48 hours: one stack, one norm, everything else a rounding error. In 2012, 73 countries are at 40 and 56 are at 48. That is 76.8% of the world on one of two numbers, split almost down the middle between them.
The median country sits at 44, and 44 is not an empty spot: 16 countries are there and 14 more at 45, a third and much smaller cluster wedged between the two peaks. So the middle of the distribution is a real place that happens to describe neither of the two positions the argument is between.
This is not a story about the world drifting apart. It is a standoff. Two numbers, sixty years, no winner.
Both numbers were copied
Where did they come from? Not, mostly, from countries working out an answer.
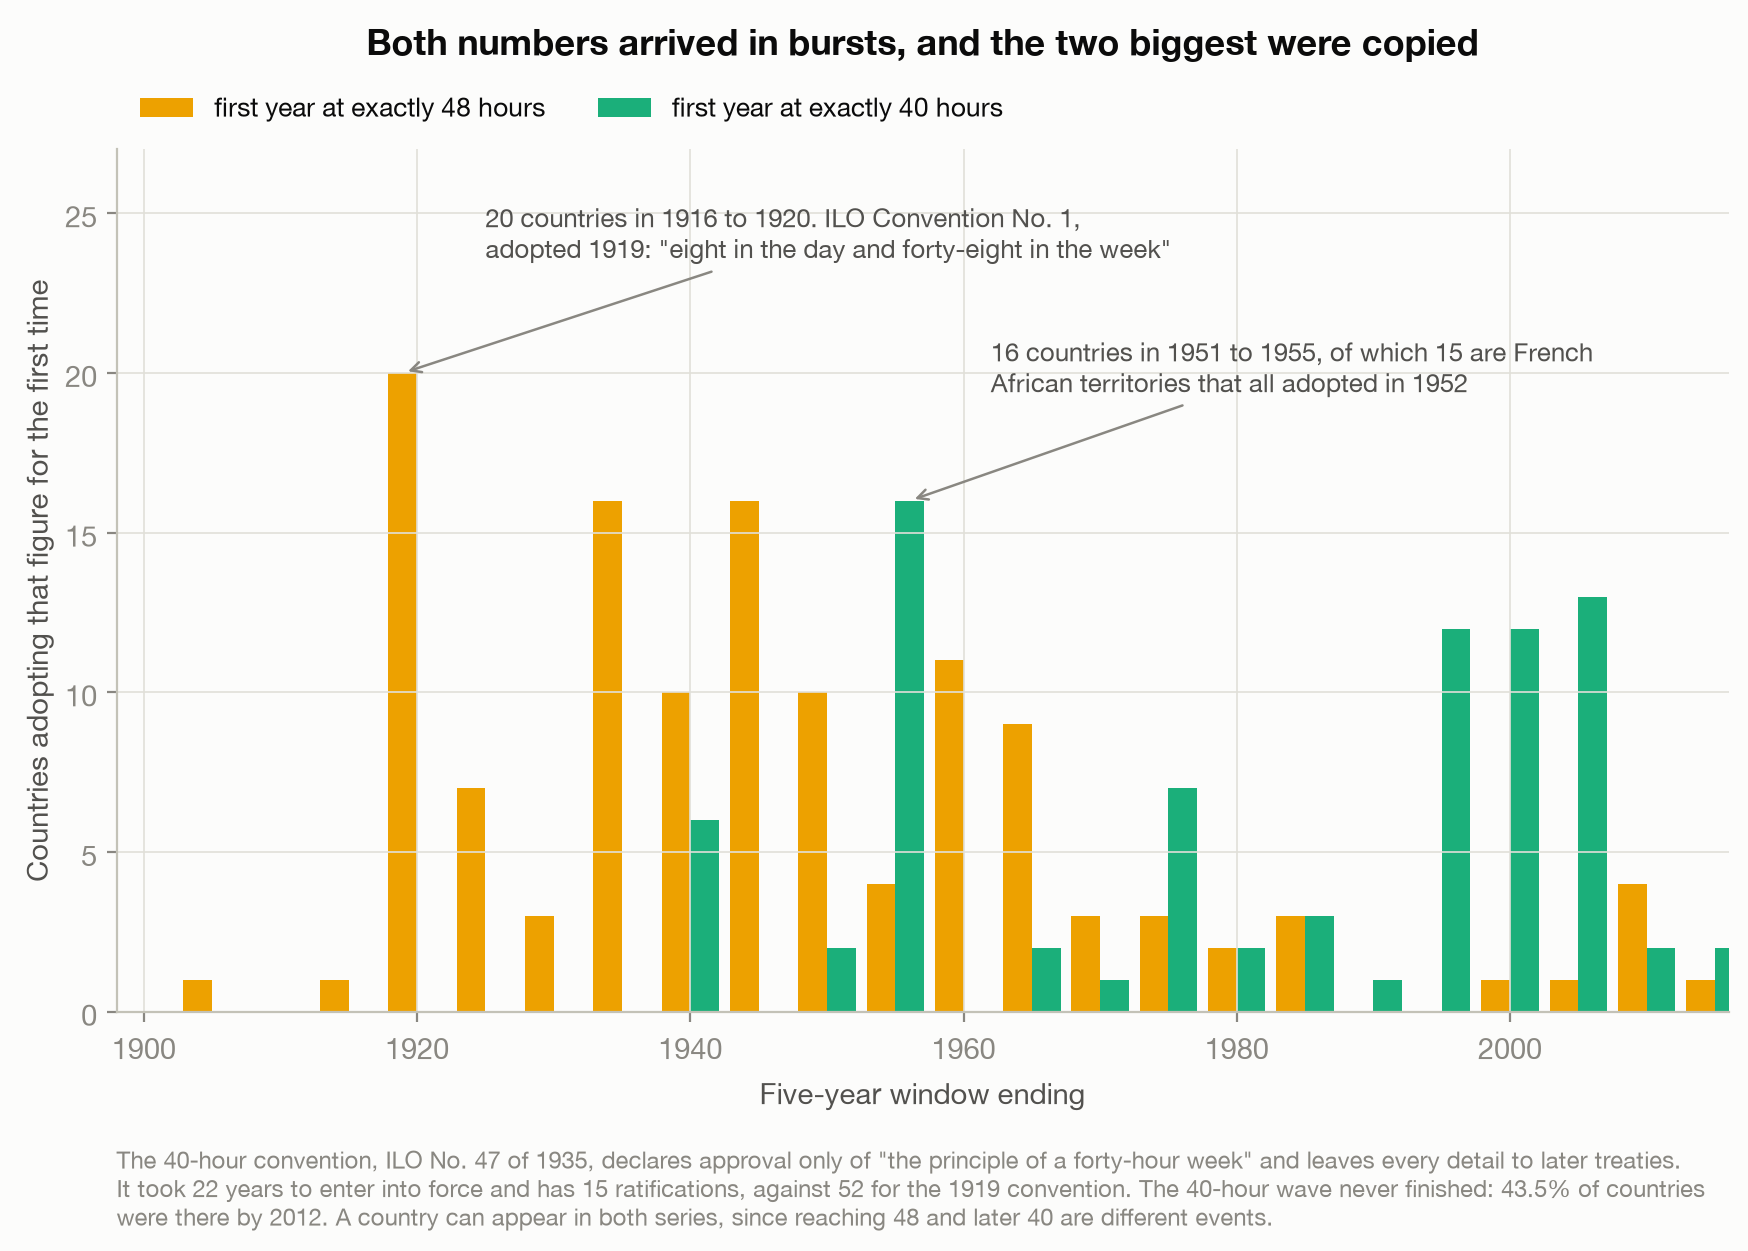
Twenty countries first set their normal week at exactly 48 hours between 1916 and 1920. That is the window containing 1919, the year the International Labour Organization adopted its very first convention, at Washington, whose Article 2 says working hours “shall not exceed eight in the day and forty-eight in the week” (International Labour Organization, 1919).
It is the tallest bar in the chart, but it is not the biggest wave in the file, and the one that beats it is more telling. Take any five consecutive years rather than the chart’s fixed bins and the largest cluster of first-time 48-hour adoptions is the five years from 1945, with 24, of which 13 are French African territories and 12 of those adopt in 1945 alone. The largest single year anywhere in the file is 1952, when fifteen French African territories adopted a 40-hour normal week at once. That is the year France passed Law n° 52-1322, establishing a labour code across its overseas territories. I could not retrieve that law’s hours provision, but I do not have to guess at the mechanism, because Rasmussen reads it the same way: he attributes the shift to the French labour code extending the 40-hour week to all the major dependencies from 1952 (Rasmussen, 2024).
The pattern is hard to miss anyway. The three largest adoption events in two centuries of this file are one treaty and two rounds of an empire legislating for its territories.
And then look at what the 40-hour wave did next, which is mostly nothing. The ILO wrote a 40-hour convention in 1935. Its Article 1 declares approval of “the principle of a forty-hour week applied in such a manner that the standard of living is not reduced in consequence” and then defers every actual detail to conventions that would be negotiated later (International Labour Organization, 1935). A principle with the implementation left blank. It took 22 years to enter into force and it has 15 ratifications. The 1919 convention has 52.
The 48-hour week arrived as a rule. The 40-hour week arrived as an aspiration. Rules travel.
Only one of the three was never standardized
Rasmussen coded three things, not one: the normal week, the overtime premium, and the maximum permitted week. Standardisation is a claim you can test on each separately, and the answers differ.
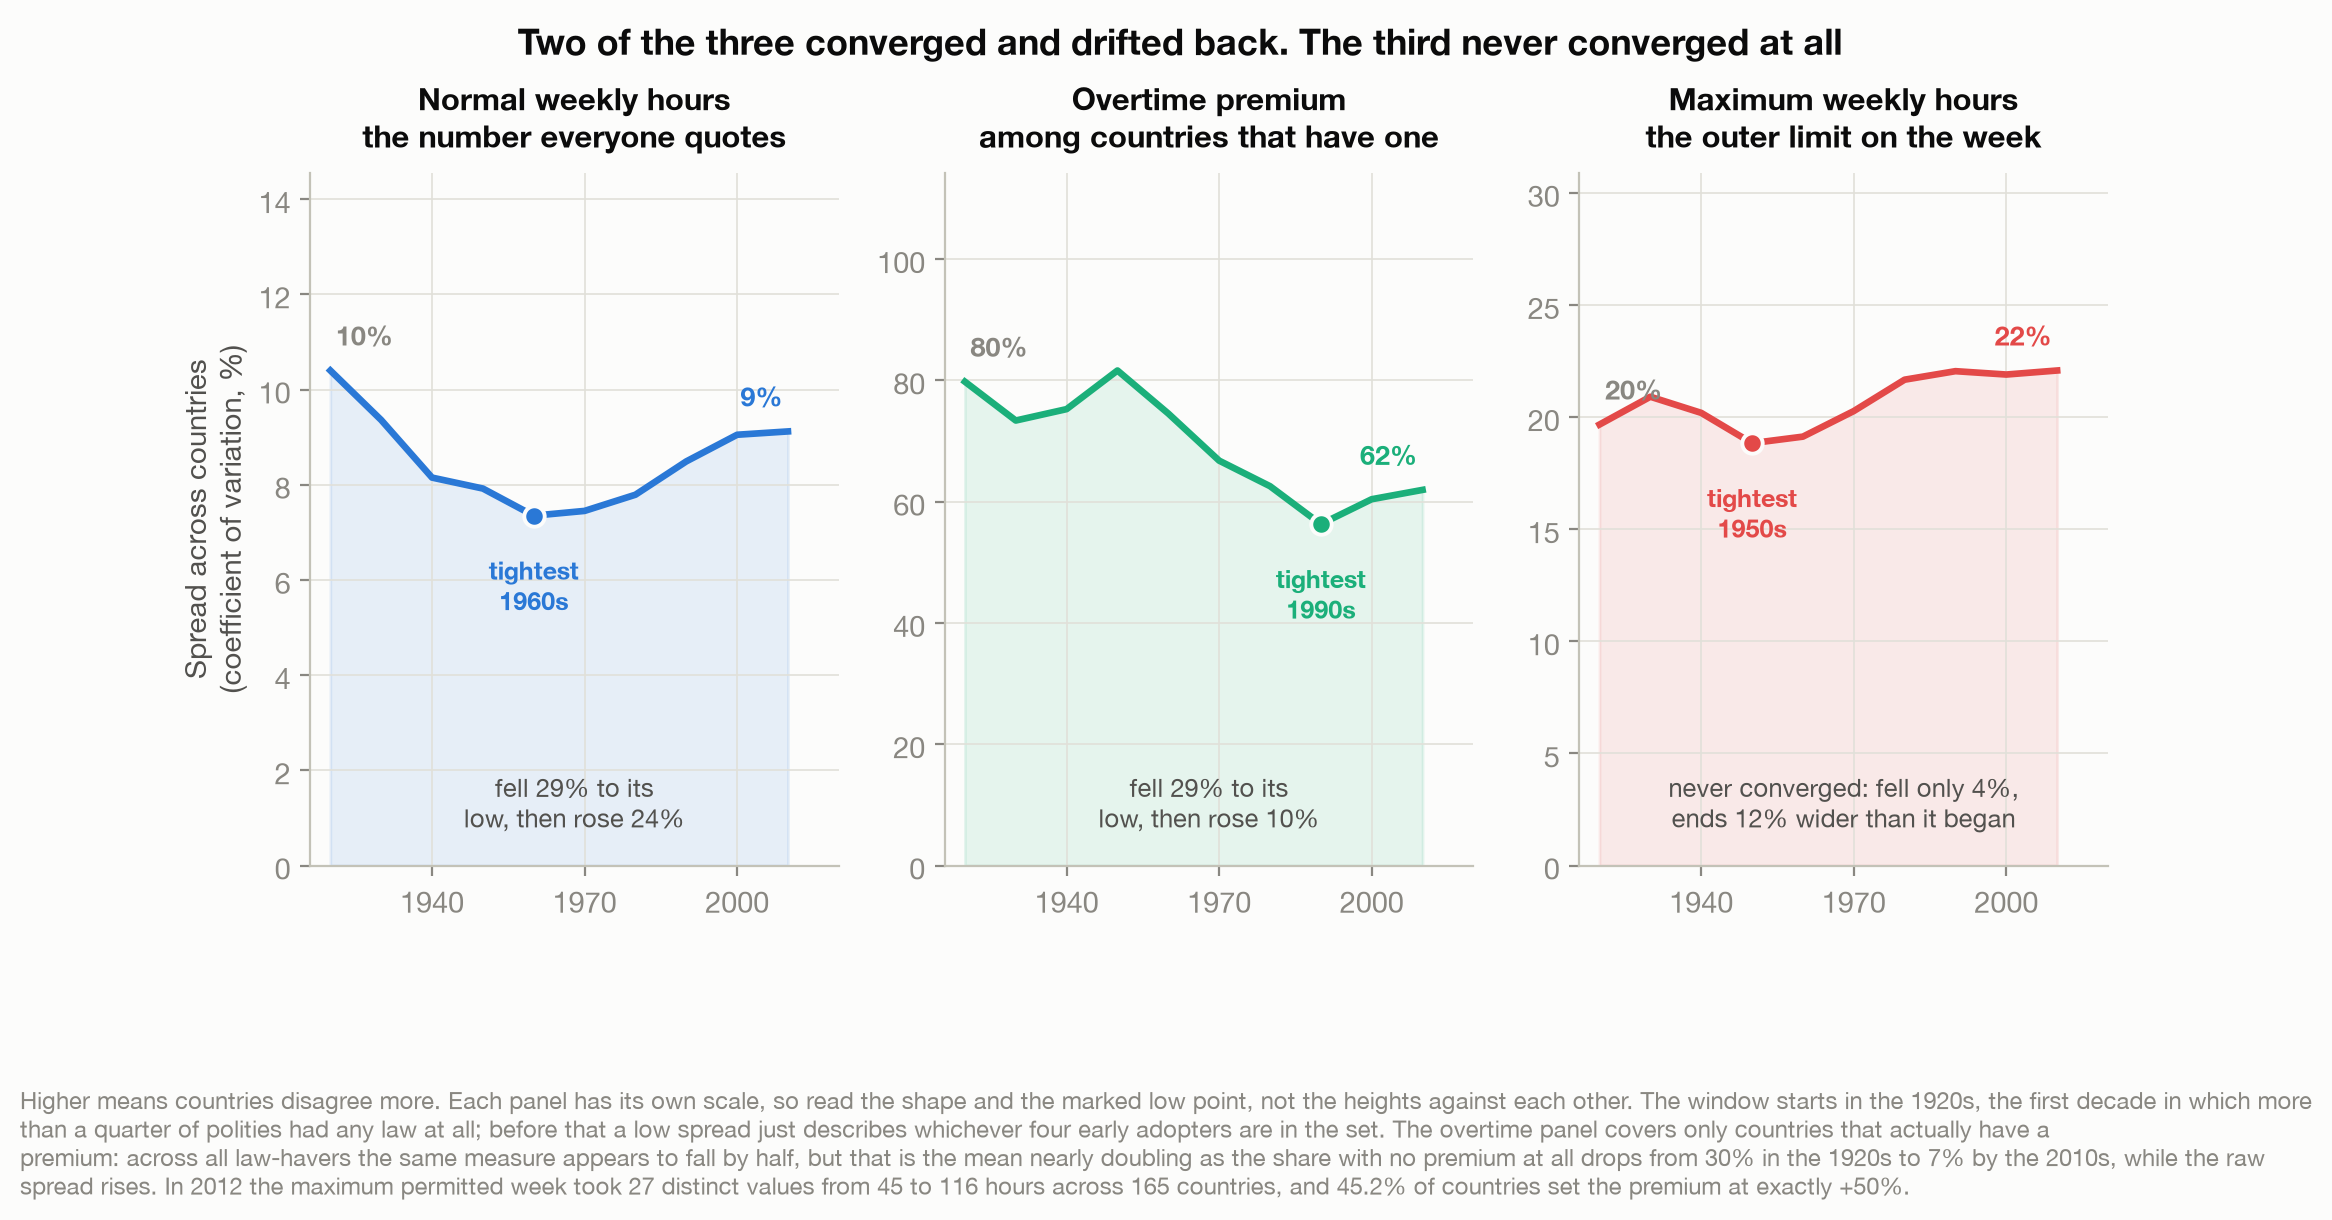
The normal week converged 29.3% from its 1920s spread to a low in the 1960s, then widened 24.0%. The overtime premium did almost exactly the same thing on a longer arc, converging 29.4% to a low in the 1990s among the countries that actually have a premium, and drifting back since. By 2012, 45.2% of all countries with a working-hours law, and 48.7% of those that have a premium at all, had settled on exactly plus 50%, which is a real and underappreciated piece of global agreement.
That overtime figure needs one caveat, because getting it wrong is easy and I did. Measured across all countries with a working-hours law, the overtime premium appears to converge by 45.8% between the 1920s and the 1990s. That is almost entirely an illusion: over the same window the share of law-havers with no premium at all fell from 30.1% to 5.6%, which nearly doubled the average premium and shrank the ratio without the absolute spread shrinking at all. Measured that way the raw standard deviation actually rose 5%. It is the same extensive-margin trap the 96 code sets for normal hours, waiting in a different column.
The maximum permitted week is the one that never converged. Its spread fell 4.2% from the 1920s to its low, which is noise, and it ends 12% wider than it began. In 2012 the maximum weekly hours allowed by law took 27 distinct values across 165 countries, ranging from 45 hours to 116.
Forty-five to a hundred and sixteen. That is the outer limit on what can lawfully be asked of you in a week, and there is no global standard for it in any meaningful sense, and there never was. The two numbers bind at different margins: the normal week binds on the payslip, since it is the line above which a premium is owed, and the maximum binds on the calendar. The one that standardised is the one that gets quoted. The one that sets the outer limit did not.
What I will not tell you
There are two readings of the widening and I am not going to pick one.
You can read it as a reform that stalled. The 40-hour week won two countries in five and then stopped; 56 countries still legislate a week that cannot be worked as five eight-hour days; the spread is not diversity but a race half the field quit. Two hundred reforms between 1904 and 2012, of which 187 were cuts and only 13 were increases, describes a ratchet.
Or you can read it as legislatures deciding for themselves. Mid-century uniformity came from empires and from one treaty everyone copied: in 1948, seventy of the ninety-six countries with a law sat on the same number, countries with nothing else in common. Divergence, in this reading, is what it looks like when a country stops importing its labour code. And the ratchet was still turning while the spread widened, with the 1990s producing more reforms than any other decade in the file.
I cannot adjudicate that here, and I want to be precise about why rather than hiding behind a caveat.
Consider that the 48-hour bloc in 2012 contains Germany, Ireland and the United Kingdom, sitting alongside Saudi Arabia, Bangladesh and Nepal. That is not a coding error, but the 48 is doing three different jobs. German law fixes eight hours per Werktag, and a Werktag runs Monday to Saturday, so Germany’s 48 really is six eight-hour days, extendable to ten if the six-month average holds (Arbeitszeitgesetz, 1994). Irish and British law both make it an average rather than a week, over a reference period of four months in Ireland (Organisation of Working Time Act, 1997) and seventeen weeks in Britain, where an individual worker may also contract out of it altogether (Working Time Regulations, 1998). The same file records the maximum permitted week in those three as 60, 60 and 72 hours. Actual weeks in all three are far shorter, for reasons written into collective agreements this dataset does not and cannot see.
Two countries can share a number for opposite reasons. So the spread is not a ranking of how hard anyone works, and I am not going to pretend it is.
The close
Every figure in this piece is a fact about a statute. Not about hours worked, not about compliance, not about the informal sector, and not about anyone outside the industrial workforce these laws were written for. The dataset is scrupulous about being what it is. I am the one who had to resist reading it as more, and the one time I stopped resisting, the answer I got was 96 hours.
What converged, for a few decades in the middle of the last century, was the text: half the world’s labour codes carried the same number because a treaty put it there in 1919 and empires copied it into their territories wholesale. That is a remarkable thing to have happened. It is also not the same thing as the world agreeing about work, and the gap between those two propositions is where every interesting question lives.
I can tell you that the paperwork stopped agreeing in 1951 and has never agreed that closely since, and that a third of it still sets a week you cannot fit into five eight-hour days. What that meant for anyone’s Saturday, this file does not know.
Method notes
Everything is computed on countries that had a working-hours law. The normalhours column codes
“no law” as 96 across 14,824 rows, exactly matching workinglaw == 0 with zero exceptions: 55% of
the rows where the column is populated, or 54.5% of all rows. Including it produces a mean of 73.4
hours. Anchoring a two-factor split at 1920, where the naive mean is 86.8, 90.6% of the fall to 46.4
in 2012 is the spread of regulation and 9.4% is regulated hours falling. That split holds between
84.5% and 96.7% across both orderings. It is deliberately not anchored at 1850, where only one
polity of 86 had a law and the split swings from 45.6% to 99.3% depending on ordering.
On Table 3 of the paper. The published series (23.68 in 1940 falling to 9.64 in 2010) reproduces to a maximum absolute error of 0.032 across all thirteen published years when computed over every polity carrying a COW code with the 96 no-law value included. On countries holding a law it does not reproduce (correlation with the published series is negative) and runs 4.68, 2.96, 3.99 for 1940, 1950 and 2010. I am not calling this an error. The table’s caption reads “for countries regulating working time”, which is what made me expect the second computation, but treating an unregulated week as 96 is a coherent choice and it measures the spread of regulation, which is the paper’s subject.
Everything ends in 2012. From 2012 to 2013, seventy countries lose hours_max to missing, while
zero countries change their normal week. Sixty-two polities coded in both years go from a positive
overtime premium to exactly zero; restricting to those coded as having a working-hours law drops
Somalia, whose law status is missing, and gives 61. In no earlier year does more than one country
make that move. The author’s page states coverage to 2014, while the paper’s appendix states the
public dataset ends in 2010; I cut at 2012 because the file is continuous through it and the 2013
break is unambiguous.
Dispersion claims state their coverage, and the yearly series is the one quoted. Chart 1 plots years, so the essay quotes years: tightest 1949 and 1950, tied at 6.22%, never matched after 1951, best since is 1967 at 7.13%, 2012 at 9.16%. Every one of those is conditioned on at least twenty countries having a law, which is also where chart 1 starts, in 1918. That condition is load-bearing rather than decorative. Among decades with at least twenty polity-years the 1890s have the lowest spread, but the 1840s, 1850s and 1860s are lower still at exactly zero, because France is the only polity with a law and it sits at 72 hours every year. Even the 1890s figure rests on four polities, all European: Austria, France, Russia and Switzerland, across 33 polity-years. The decade-pooled minimum is the 1960s, later than the yearly minimum because decade pooling absorbs the 1952 adoption wave.
The widening is measured from the peak. On the 94 countries with a law in both 1950 and 2012, the standard deviation goes 2.99 to 3.82 and the coefficient of variation 6.29% to 8.82%. The interquartile range goes 0 to 8, but that comparison is weak on its own, since 1950 sits inside the zero-IQR run and an IQR of zero cannot fall. The result also holds on the 110-country panel from a 1960 baseline. It does not hold from pre-peak baselines such as 1930, where dispersion narrows, which is what “agreement peaked in mid-century” means.
The Saturday claim is arithmetic, and Article 2(b) does not undo it. The dataset has no days-per-week column. 48 hours cannot be worked as five eight-hour days, and 56 of 168 countries legislated 48 in 2012. Article 2(b) of the 1919 convention permits exceeding eight hours on some days when others are shorter, but caps the day at nine, so even under that provision five days reach only 45 and a 48-hour week still needs a sixth. Articles 4 and 5 do allow the week to be averaged without that daily cap, but only for continuous processes and by exceptional agreement; the general rule in Article 2 is eight and forty-eight.
The 1952 attribution rests on the date and on Rasmussen’s own reading, not on the statute text. Law n° 52-1322 of 15 December 1952 is verified to exist and to have established a labour code across France’s overseas territories, but its hours provision could not be retrieved: Legifrance returns 403 and the Gallica transcription of the original is incomplete. Rasmussen (2024) attributes the 1952 shift to that code extending the 40-hour week to the major dependencies, and separately records the 48-hour week becoming the norm in French continental Africa in 1945 and 1946, which is the earlier wave this post finds on a free five-year window.
Reform counts. 200 changes to a statutory normal week between 1904 and 2012 on a country’s consecutive coded years, 187 cuts and 13 increases, median cut 4 hours. A further six diffs span a break in a country’s own coverage, including three Baltic states re-entering after half a century, and are excluded rather than counted as reforms.
Float storage. Values like 41.3 are stored as 41.299999, so hours columns are rounded to one decimal before any equality test. 40.0 and 48.0 are exactly representable, so counts at those values are unaffected.
A country can appear in both adoption series in chart 3, since first reaching 48 and later reaching 40 are separate events.
References
Arbeitszeitgesetz [Working Time Act], § 3 (1994) (Ger.). https://www.gesetze-im-internet.de/arbzg/__3.html
Organisation of Working Time Act 1997 (Act No. 20/1997), s. 15 (Ir.). https://www.irishstatutebook.ie/eli/1997/act/20/section/15/enacted/en/html
International Labour Organization. (1919). C001: Hours of Work (Industry) Convention, 1919 (No. 1). NORMLEX. Retrieved July 30, 2026, from https://normlex.ilo.org/dyn/normlex/en/f?p=NORMLEXPUB:12100:0::NO::P12100_ILO_CODE:C001
International Labour Organization. (1935). C047: Forty-Hour Week Convention, 1935 (No. 47). NORMLEX. Retrieved July 30, 2026, from https://normlex.ilo.org/dyn/normlex/en/f?p=NORMLEXPUB:12100:0::NO::P12100_ILO_CODE:C047
Loi n° 52-1322 du 15 décembre 1952 instituant un code du travail dans les territoires et territoires associés relevant du ministère de la France d’outre-mer [Law No. 52-1322 of 15 December 1952 establishing a labour code in the overseas territories and associated territories] (Fr.). Légifrance. https://www.legifrance.gouv.fr/jorf/id/JORFTEXT000000888628/
Rasmussen, M. B. (2024). The great standardisation: working hours around the world. Labor History, 65(4), 563-591. https://doi.org/10.1080/0023656X.2023.2291512
Rasmussen, M. B. (n.d.). Working time regulation in 203 independent and dependent states from 1789 to 2014 [Data set]. Retrieved July 30, 2026, from https://www.magnusbrasmussen.com/datasets
Singer-Vine, J. (2021, December 22). Data Is Plural: 2021.12.22 edition. https://www.data-is-plural.com/archive/2021-12-22-edition/
Working Time Regulations 1998, SI 1998/1833, reg. 4(1) (UK). https://www.legislation.gov.uk/uksi/1998/1833/regulation/4/made
// About the author
Jonathan Chrisnaldy is a product manager and analyst in New York City, with an M.S. in Technology Management from Columbia University. He writes data stories about the numbers behind everyday claims. More on the experience page or LinkedIn.