· 11 min read · Jonathan Chrisnaldy
What Actually Moves Your Mental Health (It Isn't the Sleep Tips)
If you want to protect your mental health, the data has a clear favorite, and it isn't a sleep app or a gym streak. It's two quieter things: work-life balance and someone to lean on. Here is what happens when you rank the levers honestly, and why it matters for whether you can work at all.
If you want to protect your mental health, the data has a clear favorite, and it is not more sleep or a gym habit. It is two quieter things: how balanced your life feels, and whether you have people to lean on. That is the whole finding, and the rest of this is me showing my work, because the ranking only becomes interesting once you see what falls when those two rise.
One honest note before any of it. The dataset I am using is simulated, “real-world inspired” in its author’s words: 500 students and working professionals, with their sleep, stress, screen time, support, workload, and a set of mental-health scores. It behaves like a teaching set, not a survey; the conditions in it are perfectly balanced and the diagnosis is largely reconstructable from the inputs, which means the relationships are clean partly because someone built them in. So read what follows as a hypothesis made visible, not proof. It happens to be a hypothesis that real research supports, which is the part that makes it worth your time.
What actually moves it
Start by combining the three distress signals in the data, stress, anxiety, and depression, into one score, where higher means worse. Then measure each lifestyle factor against it two ways: on its own, and adjusted for the fact that the factors all travel together.
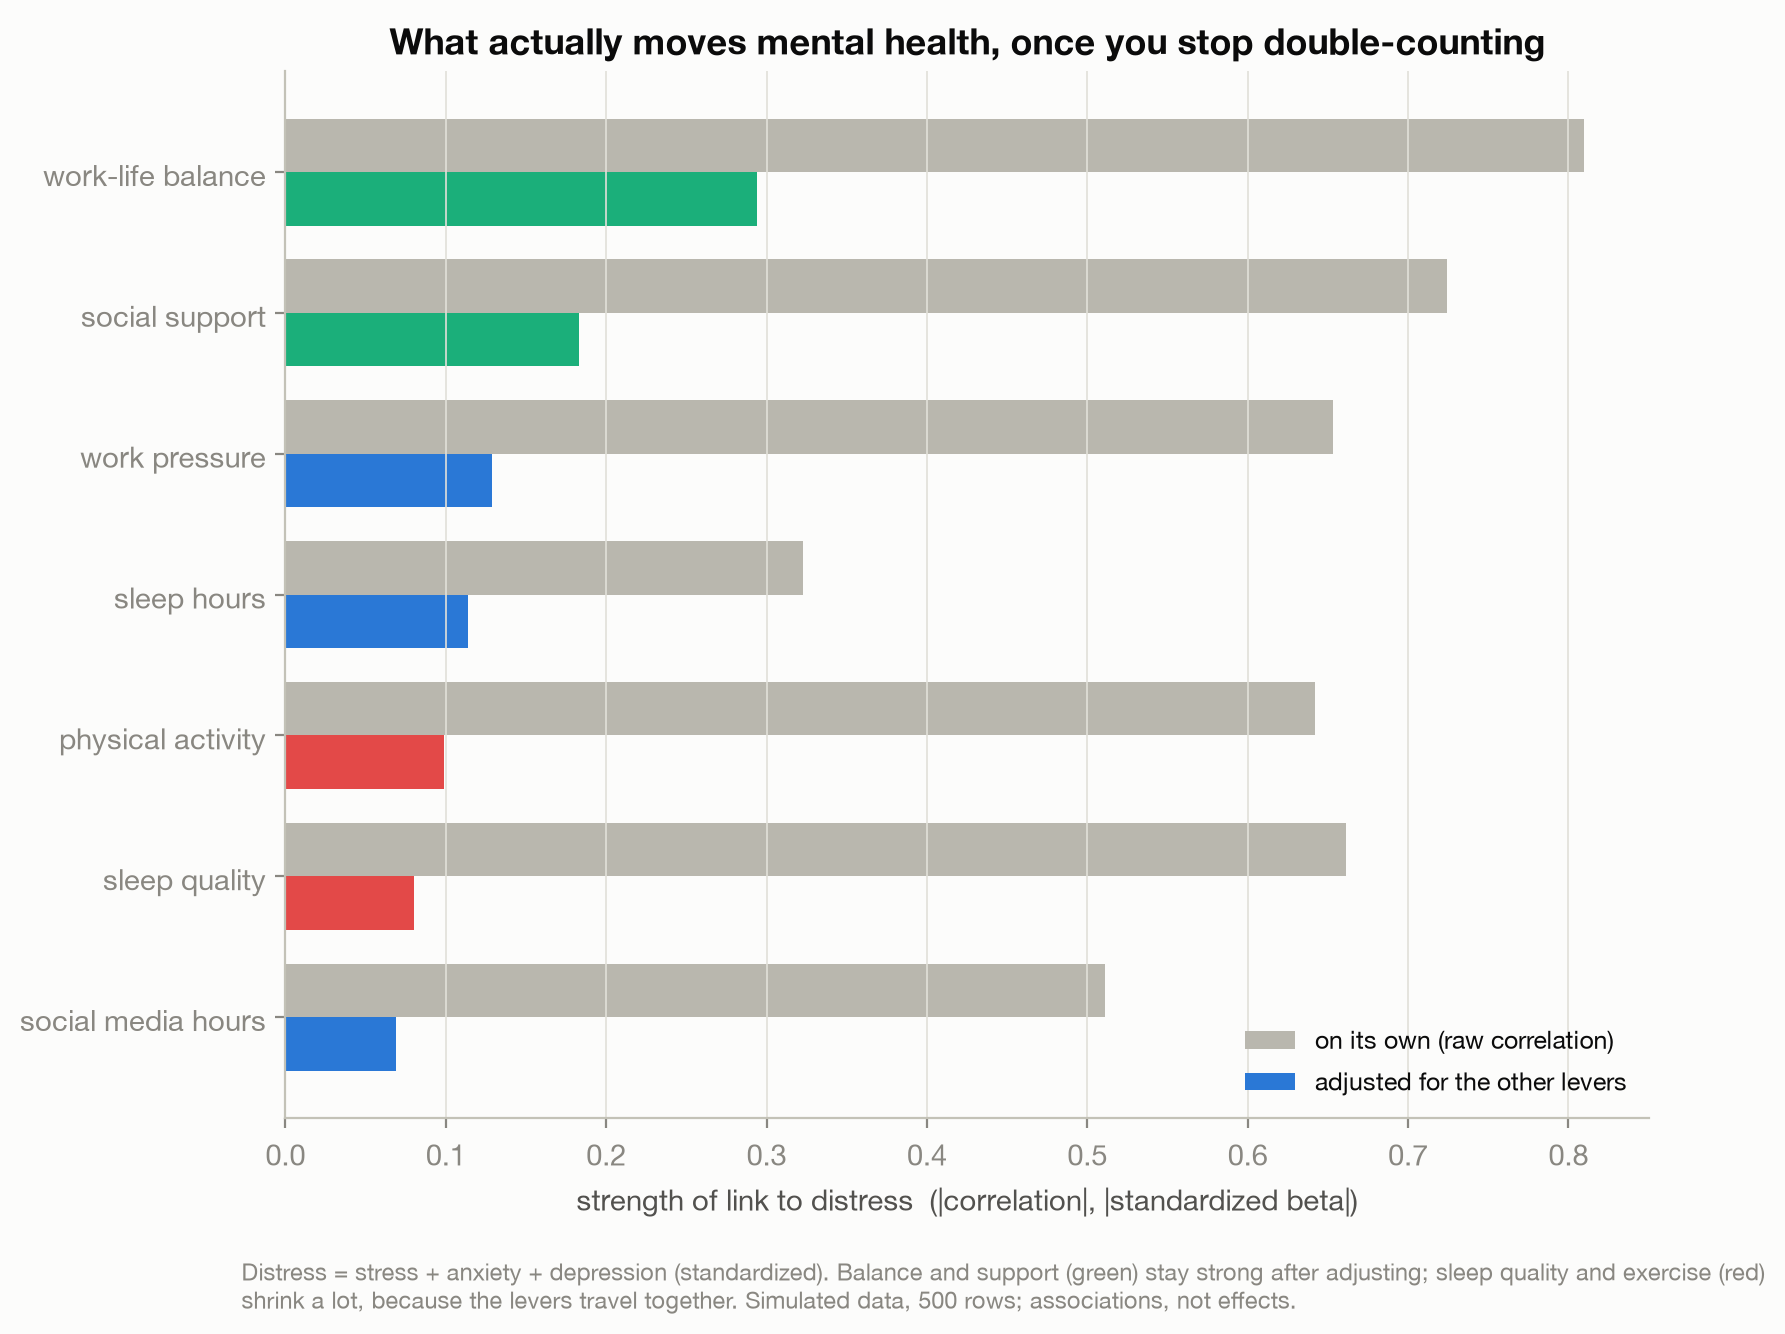
The gray bars are the simple story, the one you already believe. On its own, almost everything looks powerful. Work-life balance has a raw correlation with distress of about 0.81, social support 0.72, but sleep quality (0.66) and exercise (0.64) are right behind them, and work pressure is up there too. If you stopped here you would tell people to sleep more, move more, and hope for the best.
The colored bars are the honest story. When I put every factor on the same scale and let them compete in one model, so each one’s number is what it adds after accounting for all the others, the ranking collapses onto two levers. Work-life balance stays on top by a wide margin. Social support holds second. And the popular wellness fixes deflate: sleep quality drops from 0.66 to roughly 0.08, exercise from 0.64 to about 0.10. Most of what looked like the power of sleep and exercise was really the company they keep. People with a balanced life and people to lean on also tend to sleep better and move more, so when those factors get credit alone, they are quietly cashing a check that balance and support wrote.
This is the single most useful habit in reading any data about yourself: ask whether a factor still matters once you hold the others still. Two levers here survive that test comfortably. The rest mostly ride along.
The levers travel together, they do not cancel
I want to be careful not to overclaim the deflation, because it is easy to misread. That sleep quality and exercise shrink in this ranking does not mean they do not matter. It means that in this data their effect is hard to separate from balance and support. Real evidence is clear that they matter on their own: a meta-analysis of prospective studies found that physically active people were significantly less likely to develop depression (Schuch et al., 2018). The honest reading is not “skip the gym.” It is that exercise and sleep tend to come bundled with the bigger structural things, and if your life is out of balance and you have no support, a better sleep routine is unlikely to carry you on its own. The levers work together. The two at the top just pull the hardest.
The bridge to work
Here is where the personal becomes practical. The same levers that move with your mental health move with whether you can concentrate. The dataset has no measure of output or income, but it does have a self-rated concentration score, which is the closest thing to “can you actually get work done.” Plot it against the distress score and the link is hard to miss.
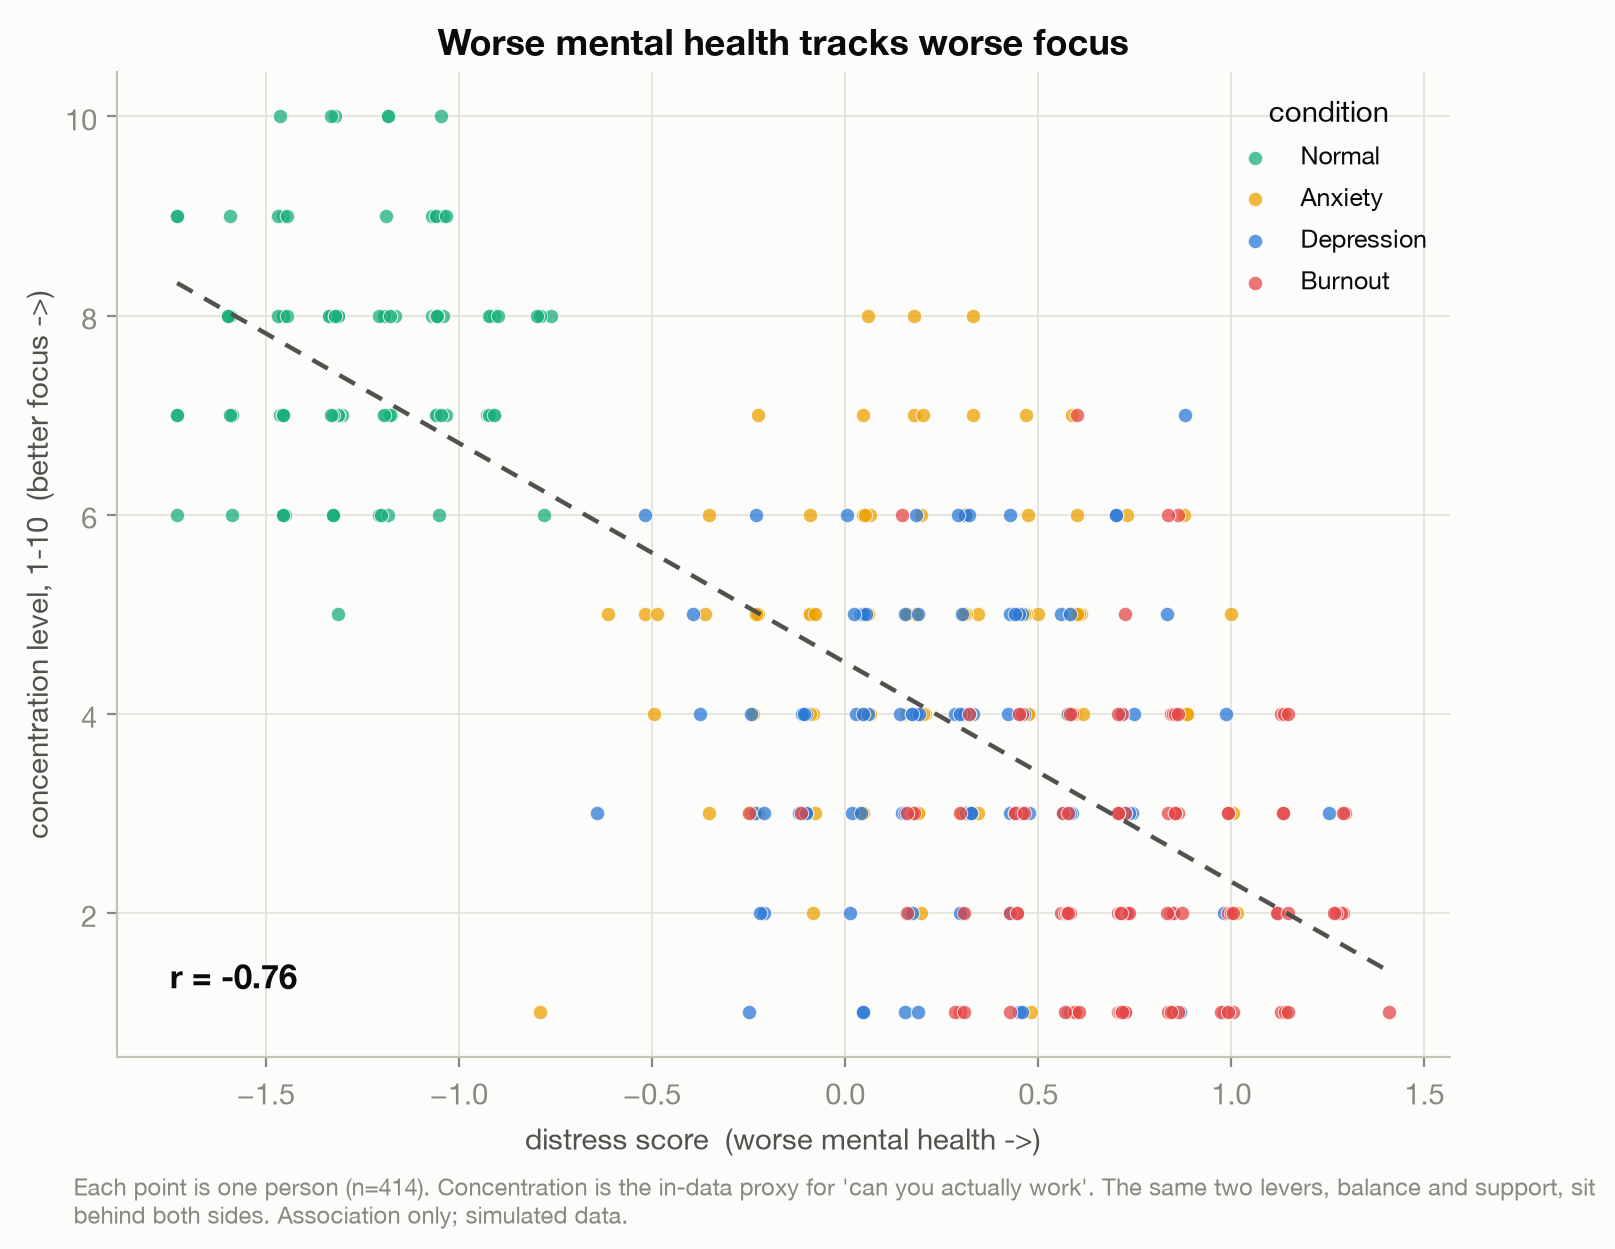
The correlation is about -0.76: as distress rises, focus falls. The trend is clear, with real scatter around it. The “Normal” group sits in the top-left, low distress and sharp focus; the “Burnout” group is stranded in the bottom-right, high distress and scattered attention. Concentration is only a proxy for productivity, not the real thing, so I will not pretend this is an output study, and a single snapshot cannot tell you which way the arrow runs, a problem I come back to in a moment. But the link itself is the practical case for caring about any of this: whatever you are trying to produce runs through a mind, and here distress and focus move together closely.
What it is worth
The dataset stops at the person, so for the scale of it I have to leave the data and go to the real world, where the numbers are large. The World Health Organization estimates that depression and anxiety cost the global economy about US$1 trillion a year in lost productivity, roughly 12 billion working days (World Health Organization, 2024).
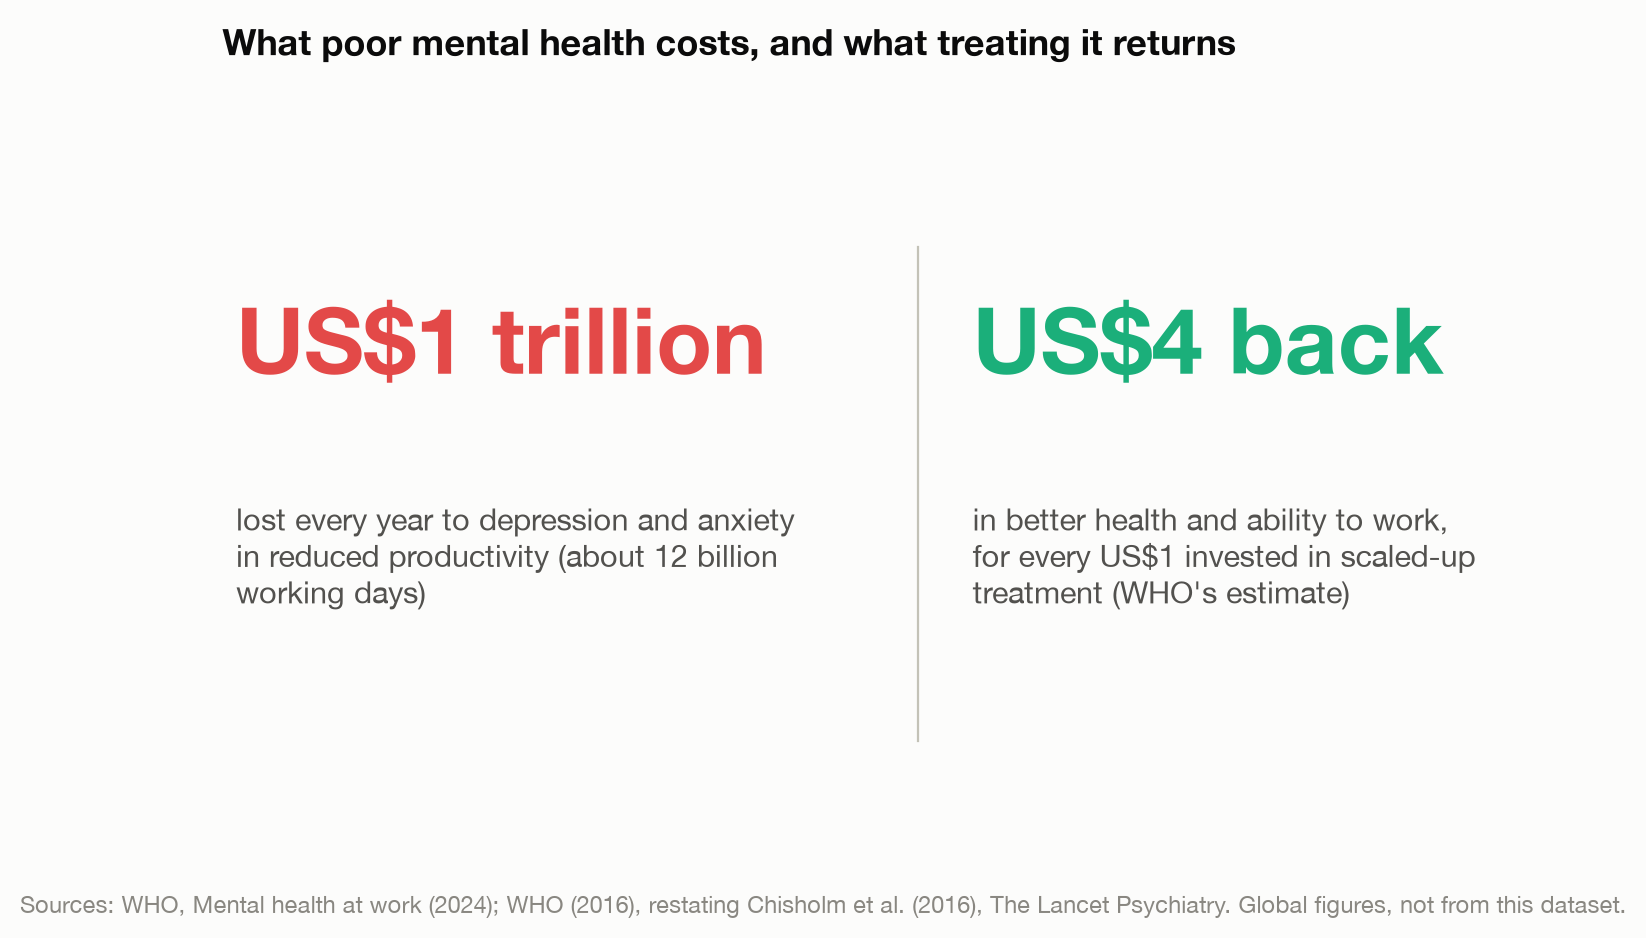
And the other direction is just as striking. The WHO, restating a global return-on-investment analysis, puts the payoff of treatment at about US$4 in better health and ability to work for every US$1 invested in scaling it up (World Health Organization, 2016; Chisholm et al., 2016). The underlying study is careful, its benefit-to-cost ratios run from a bit over 2 to nearly 6 to one depending on what you count, and the round “four” is the WHO’s headline, not a law. But the shape is not in doubt. Mental health is not a soft perk. It is one of the highest-return things a person, a company, or a country can invest in, precisely because it sits upstream of everything people are trying to do.
What this data cannot tell you
Now the limits, because they are the point, not the fine print. This dataset is simulated, so its tidy relationships are partly designed; it is the reason I have leaned on outside research at every step rather than resting the argument on these 500 rows.
It is also a single snapshot. Everyone was measured once, so there is no way to watch a person’s balance improve and their mood follow. That matters more than it sounds, because this is the real puzzle, and a genuine one: mental health and productivity are chicken and egg. Does good balance lift your mood, or do people in a good mood report their lives as more balanced? Does poor focus come from distress, or does failing at work cause the distress? A cross-sectional dataset cannot cut that loop. It can show you the pieces fit together. It cannot tell you which one moved first.
So why trust the ranking at all? Because the two levers it puts on top are the two that real, longitudinal research keeps finding. Job strain is an established risk factor for clinical depression (Madsen et al., 2017). Social support is one of the most reliable correlates of good mental health across the literature (Harandi et al., 2017). The toy data agrees with the field on the things that matter most, which is exactly when a toy is worth playing with.
Stop asking which comes first
The lesson that survives all the caveats is simple, and a little countercultural. The biggest levers on your mental health are not the medical ones or the heroic ones. They are relational and structural: a life that is not permanently tilted toward work, and people who have your back. The self-improvement industry sells the opposite, because balance and support are hard to package and a sleep gadget is easy to sell.
And you can stop asking which comes first. If mental health and productivity feed each other, the loop cuts both ways, which means the smart move is not to wait until you have earned rest by being productive. It is to treat mental health as an input, the way you would treat sleep before a race or fuel before a drive, and let the output follow. Protect the balance. Keep the people. The rest, including the work, has a much better chance of taking care of itself.
This is an analysis of lifestyle data and public research, not medical or financial advice.
Method notes
Data: Kaggle “Mental Health Prediction Dataset” (Singh, 2026), 500 simulated records. The distress score is the mean of the z-scored stress, anxiety, and depression ratings (higher is worse). Each lifestyle factor is ranked two ways: its raw correlation with distress, and its standardized regression coefficient, which puts every factor on a common scale and reports each one net of the others (cross-checked with permutation importance from a gradient-boosting model that handles the missing values natively; the two methods agree on the top). The seven factors together explain most of the variation in distress in this data (regression R-squared about 0.79, on the 319 rows complete across every field). The bridge chart is the person-level correlation between distress and self-rated concentration (about -0.76, 414 rows). The productivity and treatment figures in the third chart are external global estimates from the WHO, not computed from this dataset. All within-data relationships are associational; the data is simulated and cross-sectional, so it cannot establish cause, direction, or the mental-health-and-productivity chicken-and-egg. Concentration is a proxy for productivity, not productivity itself. Code and the analysis are on GitHub: github.com/joechrisnaldy/data-stories.
References
Chisholm, D., Sweeny, K., Sheehan, P., Rasmussen, B., Smit, F., Cuijpers, P., & Saxena, S. (2016). Scaling-up treatment of depression and anxiety: A global return on investment analysis. The Lancet Psychiatry, 3(5), 415-424. https://doi.org/10.1016/S2215-0366(16)30024-4
Harandi, T. F., Taghinasab, M. M., & Nayeri, T. D. (2017). The correlation of social support with mental health: A meta-analysis. Electronic Physician, 9(9), 5212-5222. https://doi.org/10.19082/5212
Madsen, I. E. H., Nyberg, S. T., Magnusson Hanson, L. L., Ferrie, J. E., Ahola, K., Alfredsson, L., Batty, G. D., Bjorner, J. B., Borritz, M., Burr, H., Chastang, J.-F., de Graaf, R., Dragano, N., Hamer, M., Jokela, M., Knutsson, A., Koskenvuo, M., Koskinen, A., Leineweber, C., … Kivimaki, M. (2017). Job strain as a risk factor for clinical depression: Systematic review and meta-analysis with additional individual participant data. Psychological Medicine, 47(8), 1342-1356. https://doi.org/10.1017/S003329171600355X
Schuch, F. B., Vancampfort, D., Firth, J., Rosenbaum, S., Ward, P. B., Silva, E. S., Hallgren, M., Ponce de Leon, A., Dunn, A. L., Deslandes, A. C., Fleck, M. P., Carvalho, A. F., & Stubbs, B. (2018). Physical activity and incident depression: A meta-analysis of prospective cohort studies. The American Journal of Psychiatry, 175(7), 631-648. https://doi.org/10.1176/appi.ajp.2018.17111194
Singh, H. (2026). Mental health prediction dataset [Data set]. Kaggle. https://www.kaggle.com/datasets/harpartapsingh13/mental-health-prediction-dataset
World Health Organization. (2016, April 13). Investing in treatment for depression and anxiety leads to fourfold return. https://www.who.int/news/item/13-04-2016-investing-in-treatment-for-depression-and-anxiety-leads-to-fourfold-return
World Health Organization. (2024, September 2). Mental health at work. https://www.who.int/news-room/fact-sheets/detail/mental-health-at-work
// About the author
Jonathan Chrisnaldy is a product manager and analyst in New York City, with an M.S. in Technology Management from Columbia University. He writes data stories about the numbers behind everyday claims. More on the experience page or LinkedIn.