· 13 min read · Jonathan Chrisnaldy
The Gaming-Addiction Number Nobody Checked
One Indonesian study flags 1.9% of young gamers as at risk of a gaming disorder; another finds 30.8% have already experienced one. A gap that size is not a fact about kids; it is a fact about measurement, and here is how an 'addiction score' gets built.
Two published studies of young Indonesian gamers cannot agree on how common gaming addiction is, and they miss each other by a factor of sixteen. One screens 1.9% of players as at risk of a gaming disorder. The other finds 30.8% of adolescents have already experienced one. That gap is not a fact about Indonesian kids. It is a fact about measurement.
That is the whole subject of this essay. Indonesia has about 148 million gamers, more than eight in ten of them on a phone, and it leads Southeast Asia in gaming revenue (Xsolla, 2025). It also has a growing worry about what all that playing is doing to its kids: the worried news segments, the rehab framing, the reflex to regulate. The worry is not silly. Gaming disorder is a real diagnosis, added by the World Health Organization to the ICD-11 (World Health Organization, 2019), and for a small number of people it is genuinely serious. But before a worry becomes a policy, it gets a number attached to it, and the number is where I want to slow down. When two careful studies of Indonesian adolescents disagree by sixteen times, something other than reality is doing the talking. Usually it is the definition.
The 1.9% came from a survey of more than a thousand young gamers answering a ten-item screening test; the 30.8% came from junior-high students in Banda Aceh answering a different questionnaire (Satria et al., 2024; Siste et al., 2022). Different tools, different kids, and the two do not even measure quite the same thing: one flags who is at risk, the other asks who has already experienced a disorder. There is no agreed way to count a gaming addiction, which means the count is soft, which means whoever quotes it gets to pick the figure that fits the story they already wanted to tell.
To show you how a number like that gets made, I want to take apart a dataset that does the whole trick in miniature.
What an “addiction score” actually is
I downloaded a dataset called “Gaming Addiction and Mental Health Analysis”: 250 gamers, 49 columns, an “addiction score” for each person, plus anxiety, depression, loneliness, a “burnout probability,” and a tidy “mental health risk score” (dreamtensor, 2026). It is exactly the kind of thing that ends up in a worried news segment. Run a few correlations and you could have a headline by lunch: gaming addiction is real, it is measurable, and it is hurting people.
One thing up front: this dataset is synthetic, and I am not using it as evidence about real Indonesian gamers, because it cannot speak to them at all. I am using it as a clean, dissectable example of how an “addiction score” gets built, because the trap inside it is the same trap hiding behind that sixteen-fold spread.
The score is not a measurement. It is arithmetic.
Start with the star column, the addiction score. It runs from about 12 to 68, it feels precise, and every analysis of this dataset will treat it as the thing to explain. So my first question was where it comes from.
I tried to rebuild it from the other columns. Nothing clever, just a plain linear regression, and not the flattering in-sample kind either: cross-validation, where the model has to predict scores it never saw. To keep it honest I threw out the dataset’s other engineered indices (the burnout probability, the mental-health risk score, and the rest), so the model only gets the raw stuff: hours, habits, mood scales, lifestyle.
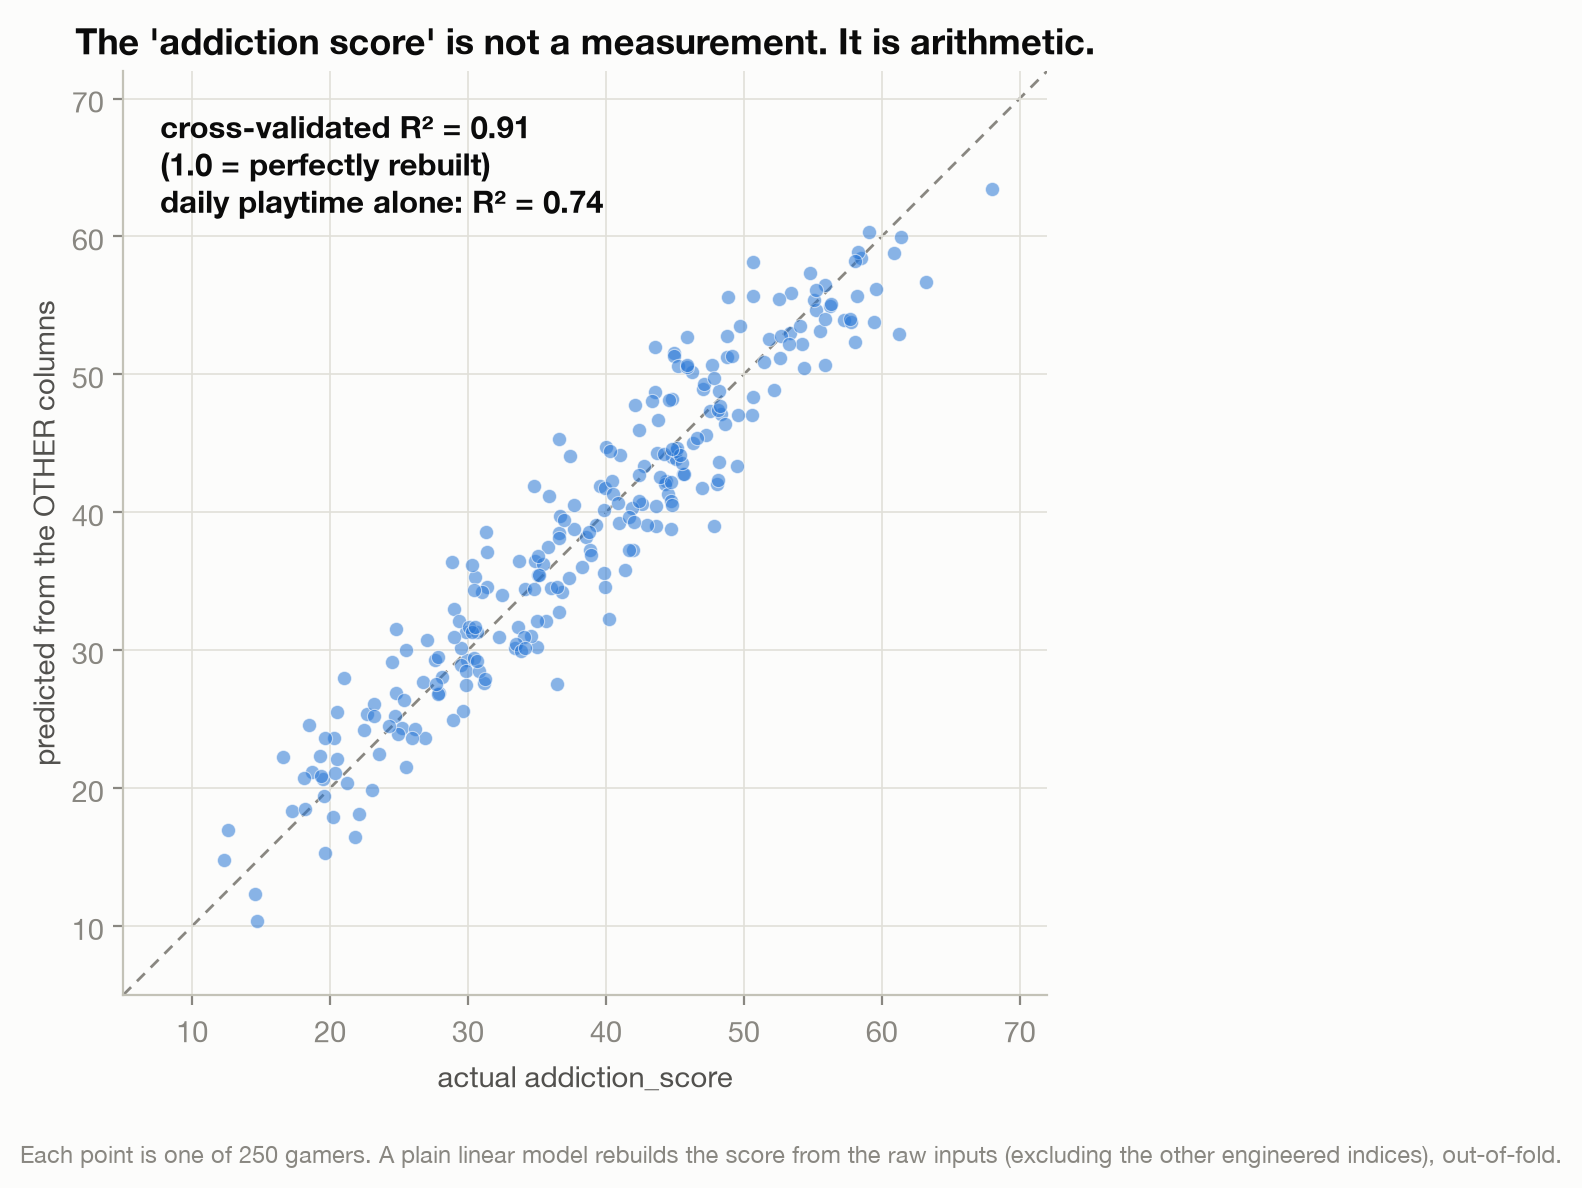
It rebuilds almost perfectly, at an R² of 0.91, where 1.0 would mean the score is entirely determined by the other columns and 0 would mean they tell you nothing. Daily playtime alone, a single column, gets you to 0.74. The addiction score is not a hidden truth waiting in the data. It is a formula, and the data already contains every ingredient.
What the formula is made of
Here I have to be fairer than the scary headline would be, because the honest version is more interesting.
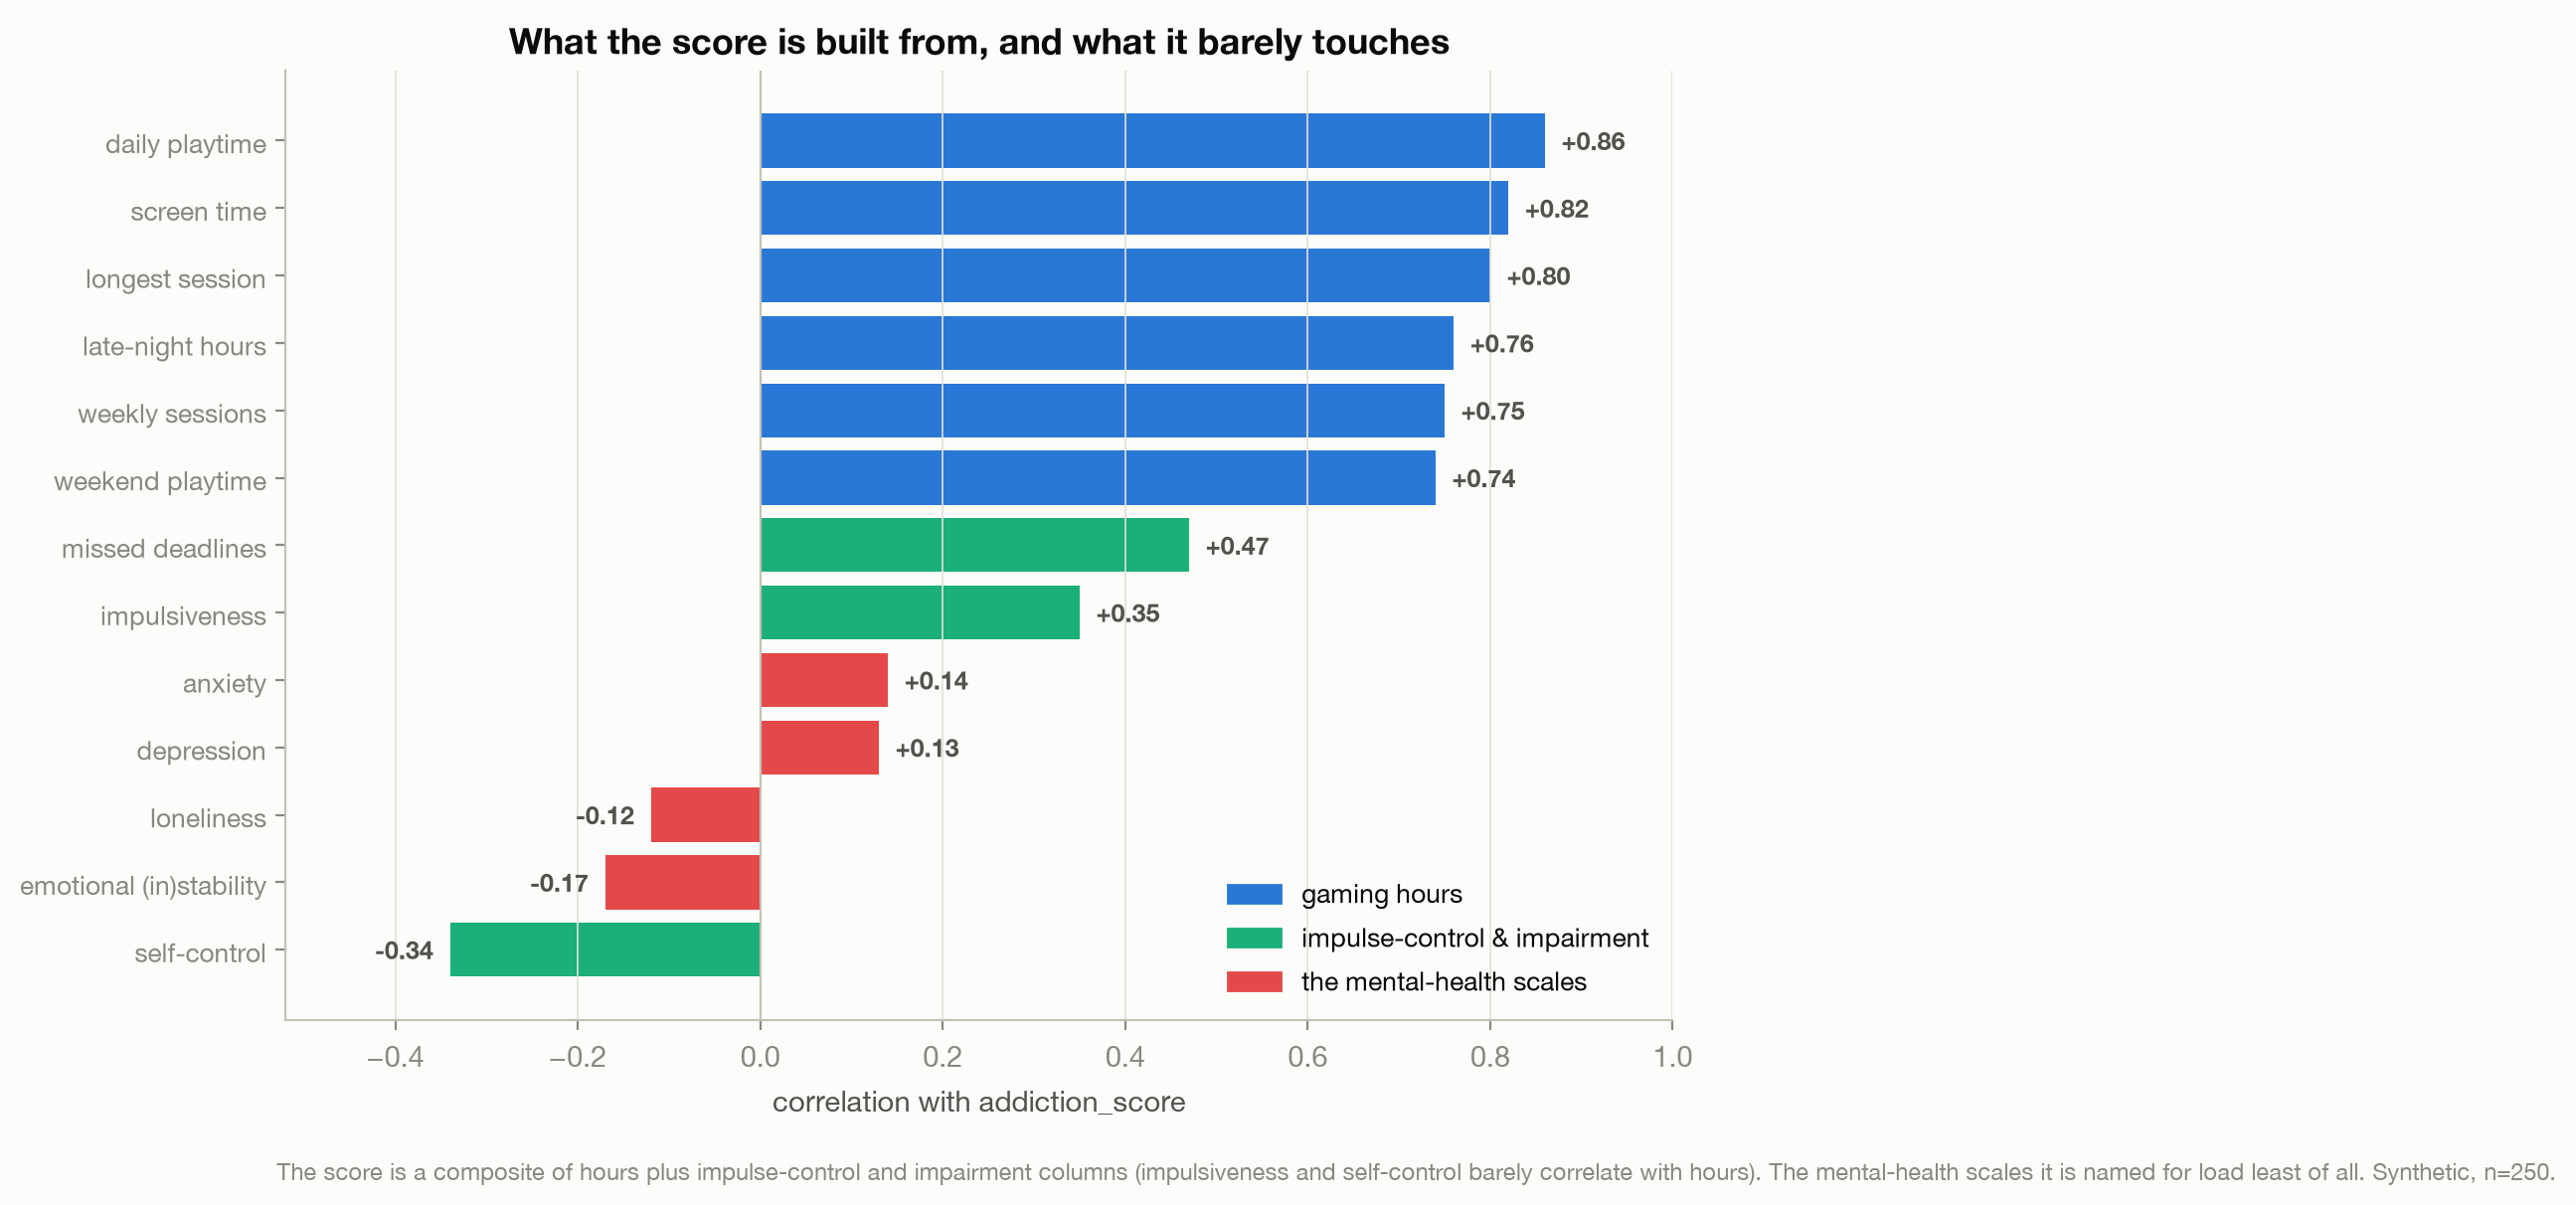
The score is not simply playtime with a frightening name. The hours columns dominate (daily playtime correlates with it at 0.86, screen time at 0.82, longest session at 0.80), but it also leans on impulsiveness and self-control, which barely correlate with hours at all (0.02 and 0.03), and on missed deadlines, a functional-impairment column, at 0.47. Time, plus poor impulse control, plus life falling behind: that is a fair sketch of what clinicians actually mean by a behavioral addiction. Which is exactly what makes the score persuasive. It looks like a real construct, not a cheap relabeling.
But look at what loads on it least. The anxiety, depression, and loneliness scales, the “mental health” half of the title, correlate with the addiction score at 0.14, 0.13, and negative 0.12. The number is built from behavior and impairment; the mental-health scales barely feed it. They are decoration in the recipe, which is a claim about how the score was built, not a claim that mental health does not matter.
An outcome you assembled out of your inputs cannot be explained by those inputs. Whatever your analysis “discovers” about what drives it, you are just reading back the recipe you used to bake it.
Any study of this dataset that reports “gamers with high addiction scores play a lot, act on impulse, and miss deadlines” will sound like a finding about suffering. It is a finding about how the score was constructed. The conclusion was installed before the first chart was drawn.
The harm is not the one the label promises
Now the part an alarming headline needs you not to check. If heavy gaming were quietly wrecking these players, the hours should track the damage. So I looked at how daily playtime relates to each wellbeing marker, and I kept only the relationships large enough to trust on 250 people.
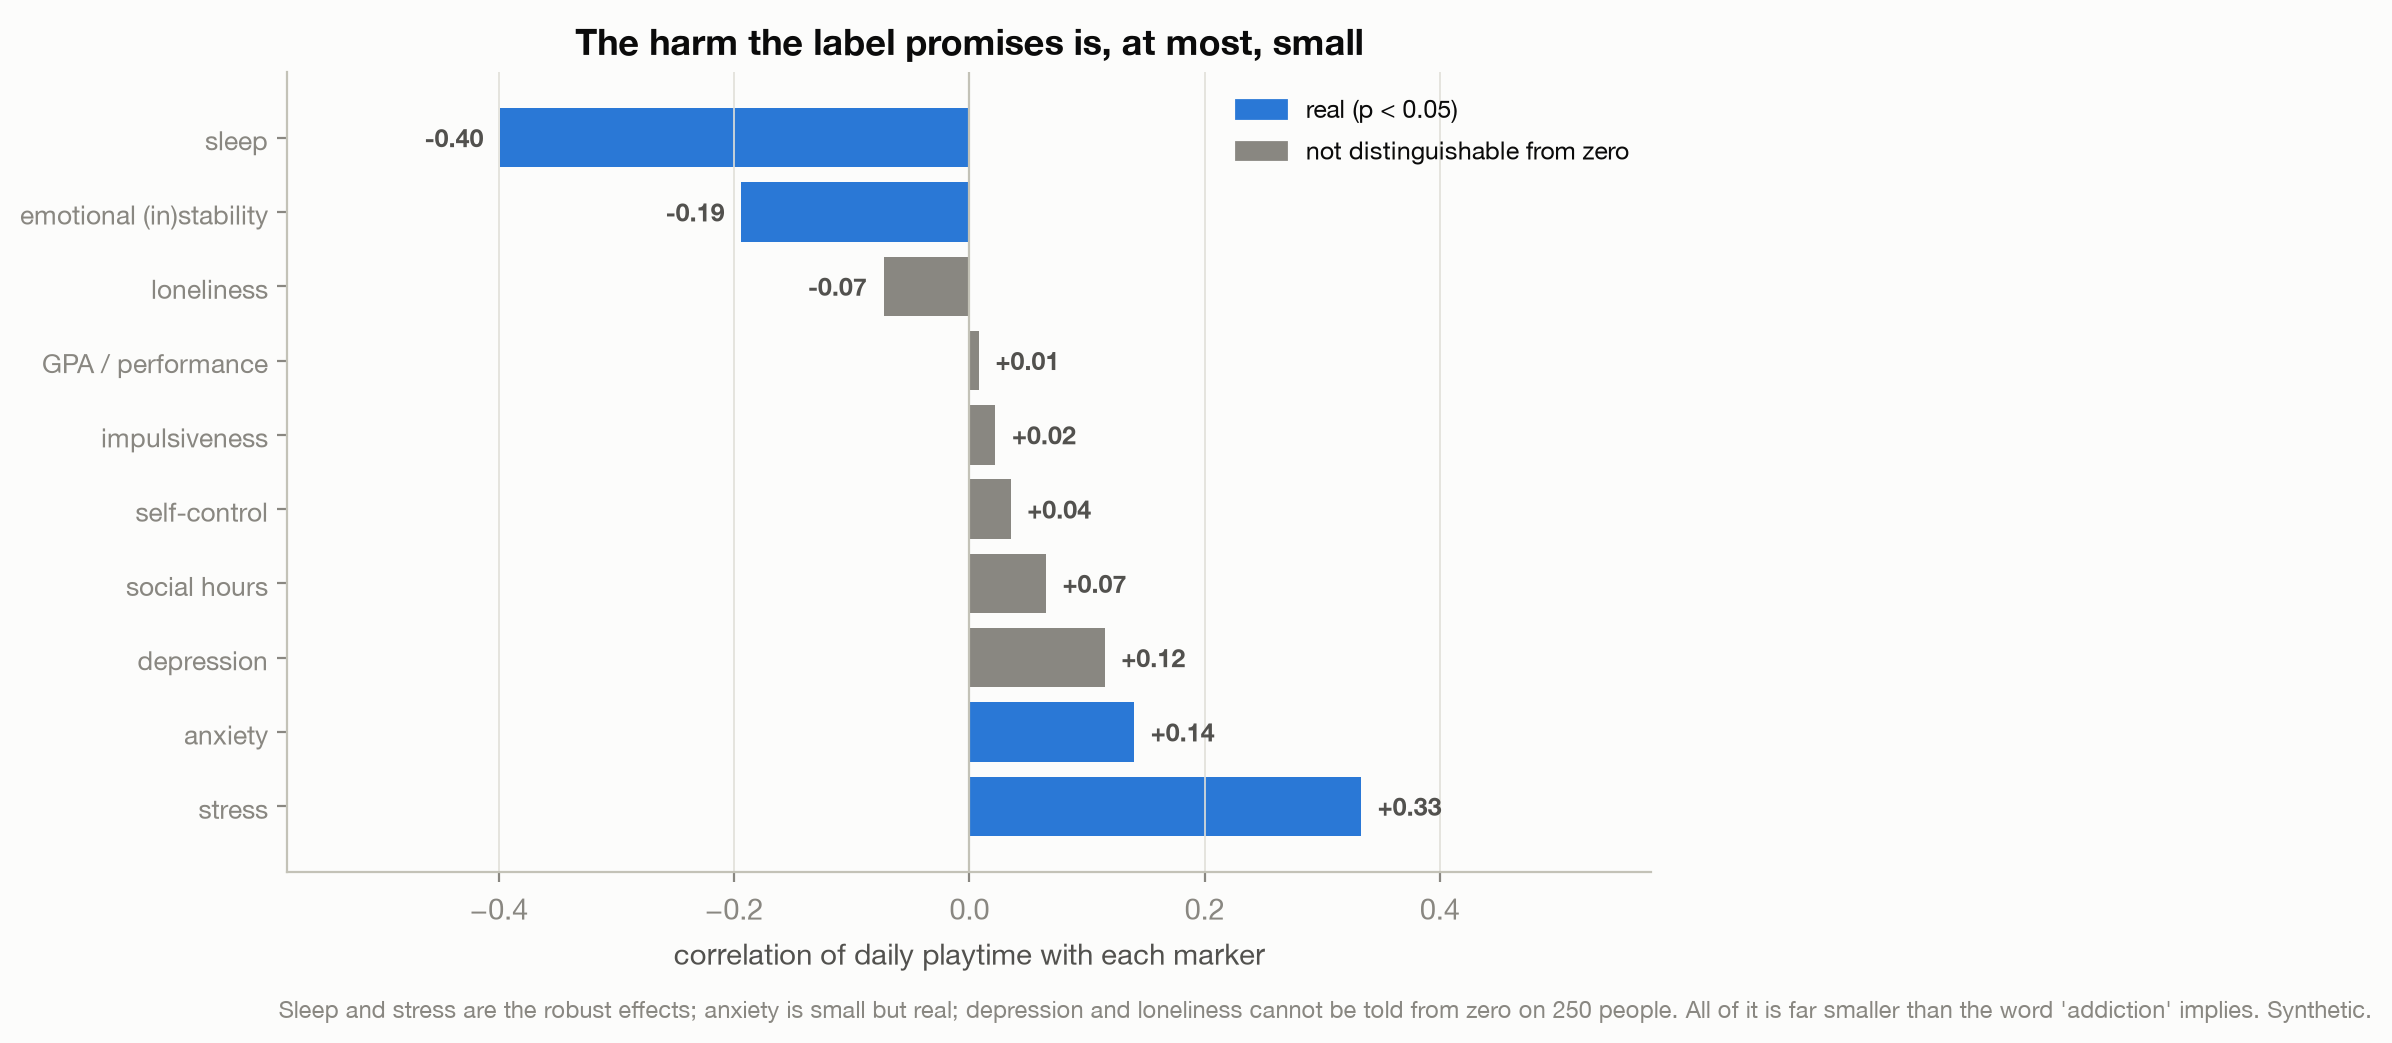
The effects are real, but they are not the ones the title advertises. The two that clearly move are sleep and stress: people who play more sleep less (a correlation of negative 0.40) and report more stress (0.33), both moderate and neither shocking. Anxiety and emotional steadiness show genuine but smaller links (playtime nudges anxiety up 0.14 and steadiness down 0.19). And the headline horrors, depression and loneliness, do not move in a way you could tell apart from zero on this sample. So the picture is a modest link to sleep and stress, not the mental-health catastrophe that the word “addiction,” or a burnout probability pinned at 1.0, is promising you.
I want to be careful, because it would be easy to overclaim in the other direction. This is not evidence that gaming is harmless. It is one small synthetic dataset, and small samples hide real effects all the time. It happens to line up with what careful research on the broader question finds: when scientists measure screen time against teenage wellbeing across hundreds of thousands of real adolescents, the effect is real but tiny, on the order of a fraction of a percent of the variation (Orben & Przybylski, 2019). The point is not that gaming is safe. It is that this dataset’s drama lives entirely in its labels, not in its numbers.
How you know it was built, not found
The dataset is described as exploratory, and its author never claimed otherwise, so this is not an accusation. But you would not know any of that from the columns, and that is the danger. Notice the tells, the small places where a constructed dataset forgets to imitate a real one.
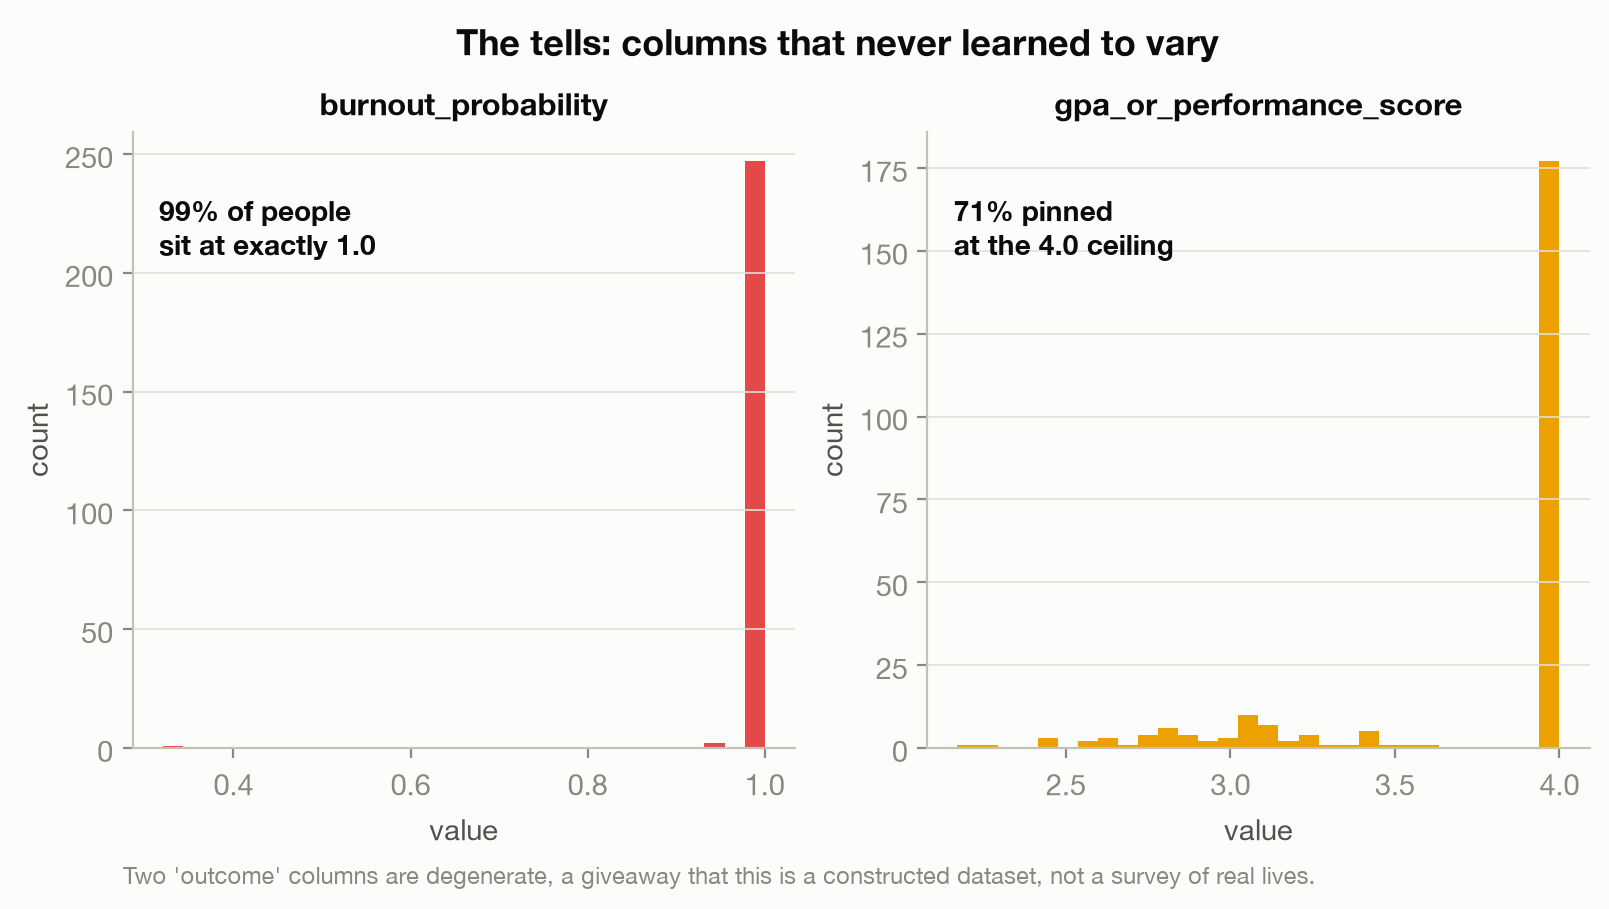
Two “outcome” columns never learned to vary. Burnout probability is exactly 1.0 for 99% of people, as if every gamer alive is certain to burn out. Academic performance is pinned at the 4.0 ceiling for 71% of them. Real lives do not stack onto a single value; generated columns do, when a formula sets them and moves on. The “addiction” here is a machine that produces a conclusion, and the conclusion is convincing right up until you ask where the number came from.
Measure before you panic
Now back to Indonesia, and to the sixteen-fold spread. I am not saying those two Indonesian studies did what this synthetic dataset does; they are real research, done carefully, and the honest reason their numbers disagree is more ordinary and more important. There is no single agreed instrument for “gaming addiction,” no thermometer everyone trusts. Change the questionnaire, change the cutoff, change which kids you ask, and the prevalence swings from one in fifty to nearly one in three. When the ruler is that soft, the number stops being a measurement of the world and becomes a measurement of the choice you made.
That is a problem, because the number is what travels. A parent, a headline, a member of parliament reaching for a reason to act does not adopt a questionnaire; they adopt a figure. “Nearly a third of our teenagers are addicted to games” writes itself into a speech far more easily than “somewhere between 2% and 31%, depending on how you count.” Once the scary version is in the speech, the policy follows the number, not the evidence.
This is the third of these essays I have written, and without planning it they became the same story told with different rulers: Moscow apartment prices that looked stable only because we measured them in a collapsing currency, a “less accurate” model that won because someone chose the metric, and now an addiction score cut to fit its answer before anyone picked it up. The measuring stick keeps turning out to be the whole story.
So here is the boring defense that actually works, and it is the same one the fake dataset teaches. Before you trust any addiction figure, ask two questions. How was “addiction” defined, and was the outcome built out of the very things you would use to explain it? If a “customer health score” is made of usage, healthy customers will use the product a lot, and you have learned nothing. If an “addiction score” is made of the very behaviors you would use to spot an addiction, the hours, the impulsiveness, the missed deadlines, then the people it flags will show those behaviors, and you have learned nothing. The same reflex catches a manufactured dataset and a soft prevalence statistic. Both look like knowledge; both are often just a definition wearing a confidence interval.
Indonesia has real reasons to care about 148 million players, plenty of them young and on a phone past midnight. That care deserves a real number, one you could defend when someone asks how it was built. The country does not need to panic about a number nobody checked. It needs to check the number first, and then decide whether there is anything to panic about.
Method notes
Data: Kaggle dataset “Gaming Addiction and Mental Health Analysis” (dreamtensor, 2026), one file, 250 rows and 49 columns, presented by its author as exploratory. The reconstruction of the addiction score uses ordinary least squares with 5-fold cross-validation (median imputation for the few missing values). The headline R² of 0.91 uses the raw feature columns and excludes the dataset’s other engineered indices (dopamine dependency, mental-health risk, burnout, churn), so it is not one composite predicting another; including everything gives 0.94, and daily playtime alone gives 0.74. Correlations are Pearson; the wellbeing relationships are kept only where they clear p < 0.05 on this sample (sleep, stress, anxiety, and emotional stability do; depression and loneliness do not). The tells: burnout probability equals 1.0 for 98.8% of rows and the performance score equals 4.0 for 70.8%. The two Indonesian prevalence figures come from different instruments and samples (Siste et al., 2022, a survey of more than a thousand young gamers using the IGDT-10, which flags at-risk screening; Satria et al., 2024, Banda Aceh junior-high students using the IGDS9-SF), which is exactly why they diverge. Caveats: the dataset has n = 250 and is synthetic, so nothing in it is a claim about real gamers or about gaming disorder, which is real and serious; small samples can hide real effects; and the critique is of treating a constructed artifact as evidence, not of the dataset’s author. Code and notebook are on GitHub: github.com/joechrisnaldy/data-stories.
References
dreamtensor. (2026). Gaming addiction and mental health analysis [Data set]. Kaggle. https://www.kaggle.com/datasets/dreamtensor/gaming-addiction-and-mental-health-analysis
Orben, A., & Przybylski, A. K. (2019). The association between adolescent well-being and digital technology use. Nature Human Behaviour, 3(2), 173-182. https://doi.org/10.1038/s41562-018-0506-1
Satria, B., Mustanir, M., Oktari, R. S., & Marthoenis, M. (2024). Gaming disorder among adolescent in Indonesia: A multi-settings cross-sectional study. Acta Biomedica, 95(5), e2024147. https://doi.org/10.23750/abm.v95i5.15826
Siste, K., Hanafi, E., Sen, L. T., Damayanti, R., Beatrice, E., & Ismail, R. I. (2022). Psychometric properties of the Indonesian Ten-item Internet Gaming Disorder Test and a latent class analysis of gamer population among youths. PLOS ONE, 17(6), e0269528. https://doi.org/10.1371/journal.pone.0269528
World Health Organization. (2019). International classification of diseases for mortality and morbidity statistics (11th ed.). https://icd.who.int/browse11
Xsolla. (2025). Indonesia’s gaming market: A rising force in Southeast Asia. Xsolla. https://xsolla.com/blog/indonesia-has-a-winning-video-game-market
// About the author
Jonathan Chrisnaldy is a product manager and analyst in New York City, with an M.S. in Technology Management from Columbia University. He writes data stories about the numbers behind everyday claims. More on the experience page or LinkedIn.