· 12 min read · Jonathan Chrisnaldy
Property Isn't the Hedge You Think
When Russia's currency collapsed in 2014, Moscow apartment prices didn't fall; they rose. That's exactly how property owners lost a third of their wealth in world prices without noticing. A data story about the most dangerous kind of stability.
Almost every Indonesian family I know keeps the same three-item list of safe assets: tanah, rumah, emas. Land, house, gold. Salaries are for spending; property is where wealth goes to be protected. The belief runs so deep it barely counts as a belief; it’s just what money does.
I found a stress test for that instinct: 30,471 Moscow apartment sales from August 2011 to June 2015, published by Sberbank for a Kaggle competition. Right in the middle of that window, Russia’s currency collapsed. If property really is the ultimate hedge, this is where it proves itself.
It doesn’t.
Moscow, December 2014
The setup, briefly. Through 2014, oil, the thing Russia’s budget and currency actually run on, fell from around $107 a barrel in January to $46 by the following January. Sanctions over Crimea cut off Western financing. The ruble went from 33 per dollar to a monthly average of 64 at the worst point in early 2015. In the middle of one December night, the central bank raised its key rate to 17% trying to stop the bleeding. Russians famously rushed out to swap their melting rubles for anything solid: televisions, German cars, and, as we’ll see in the data, apartments.
So: a proper currency crisis, with a large, obsessively-tracked property market sitting in the middle of it. What did that market do?
The most reassuring chart in Russia
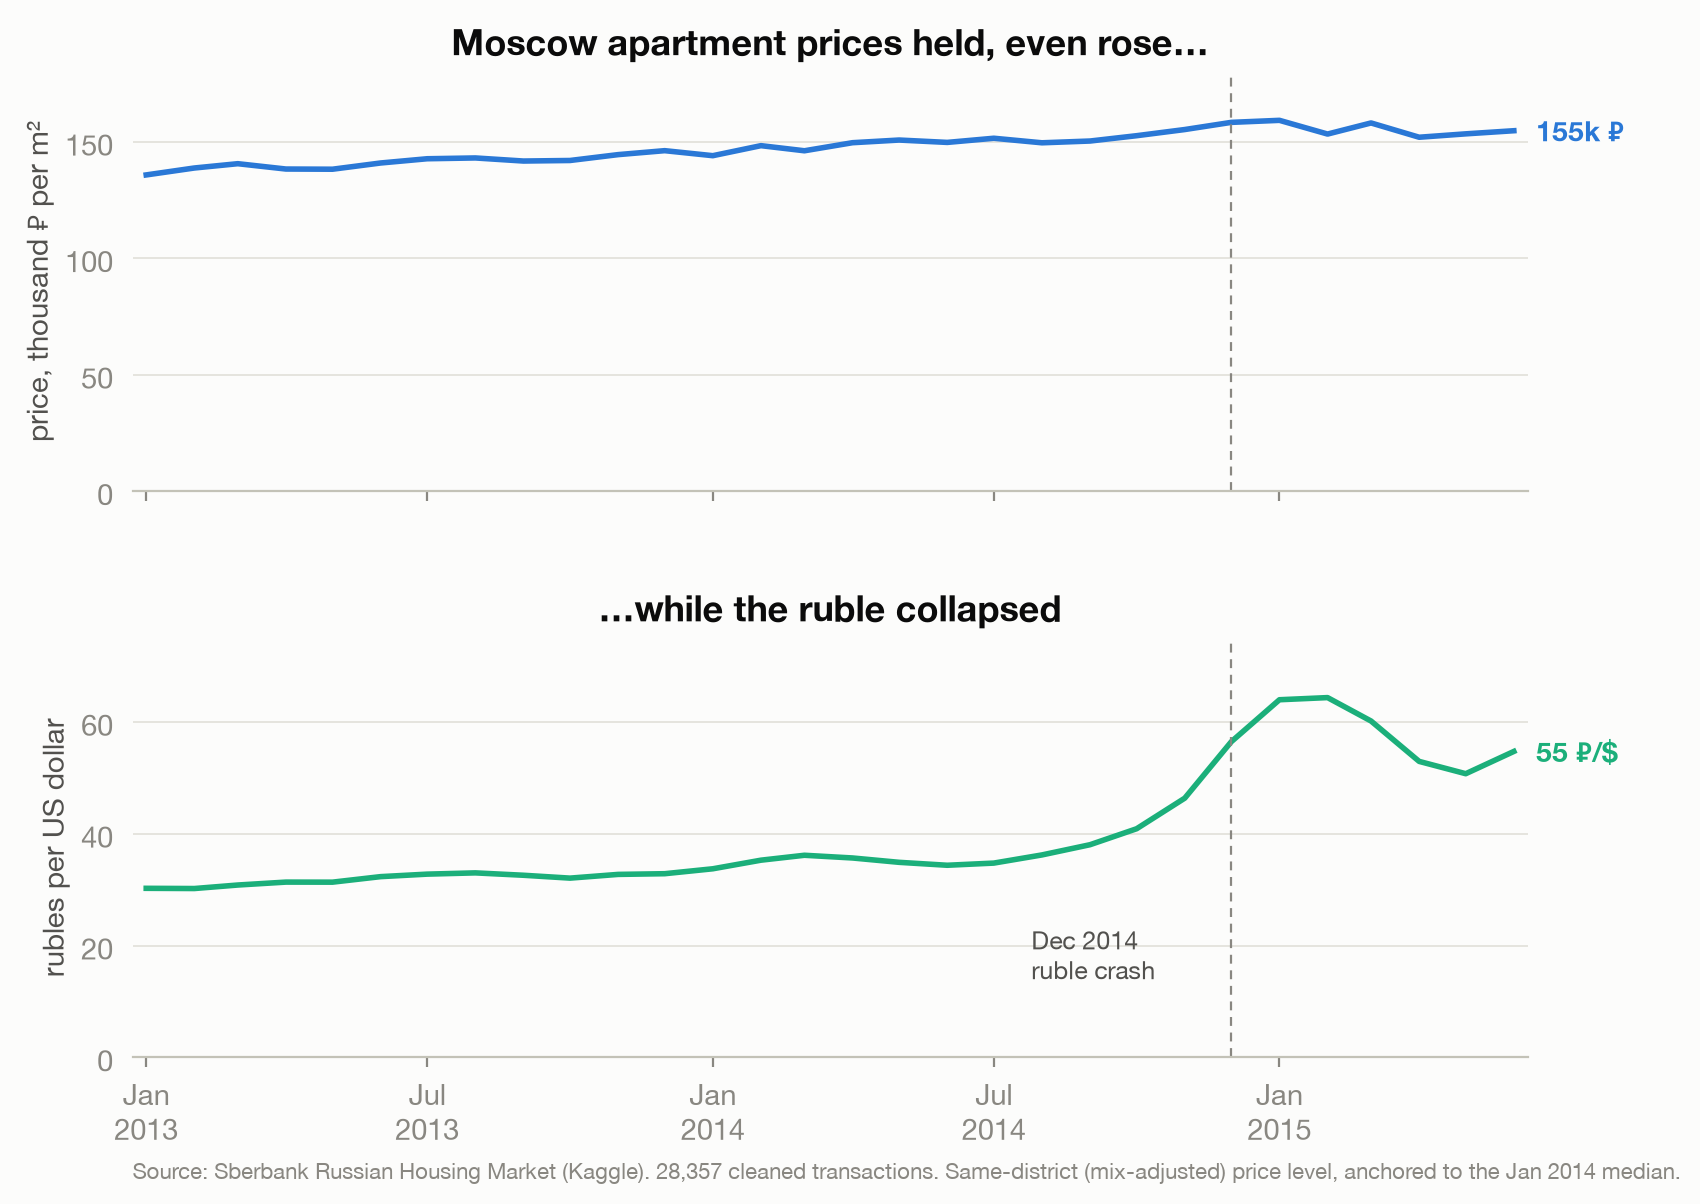
In rubles, Moscow apartment prices didn’t just survive the crisis; they drifted up about 7% between January 2014 and June 2015. That figure is like-for-like: I dropped 1,504 fake declared prices (apartments “sold” for exactly 1 or 2 million rubles, a tax dodge) and held the neighborhood mix constant, because Moscow annexed the much cheaper “New Moscow” territories in 2012 and their share of sales swings wildly month to month (details in the method notes).
Like-for-like, in the middle of a collapse, the asset went up. If you owned a Moscow flat and thought in rubles, which is how nearly everyone thinks, you felt fine. You may have felt clever.
Change the measuring stick and the story collapses
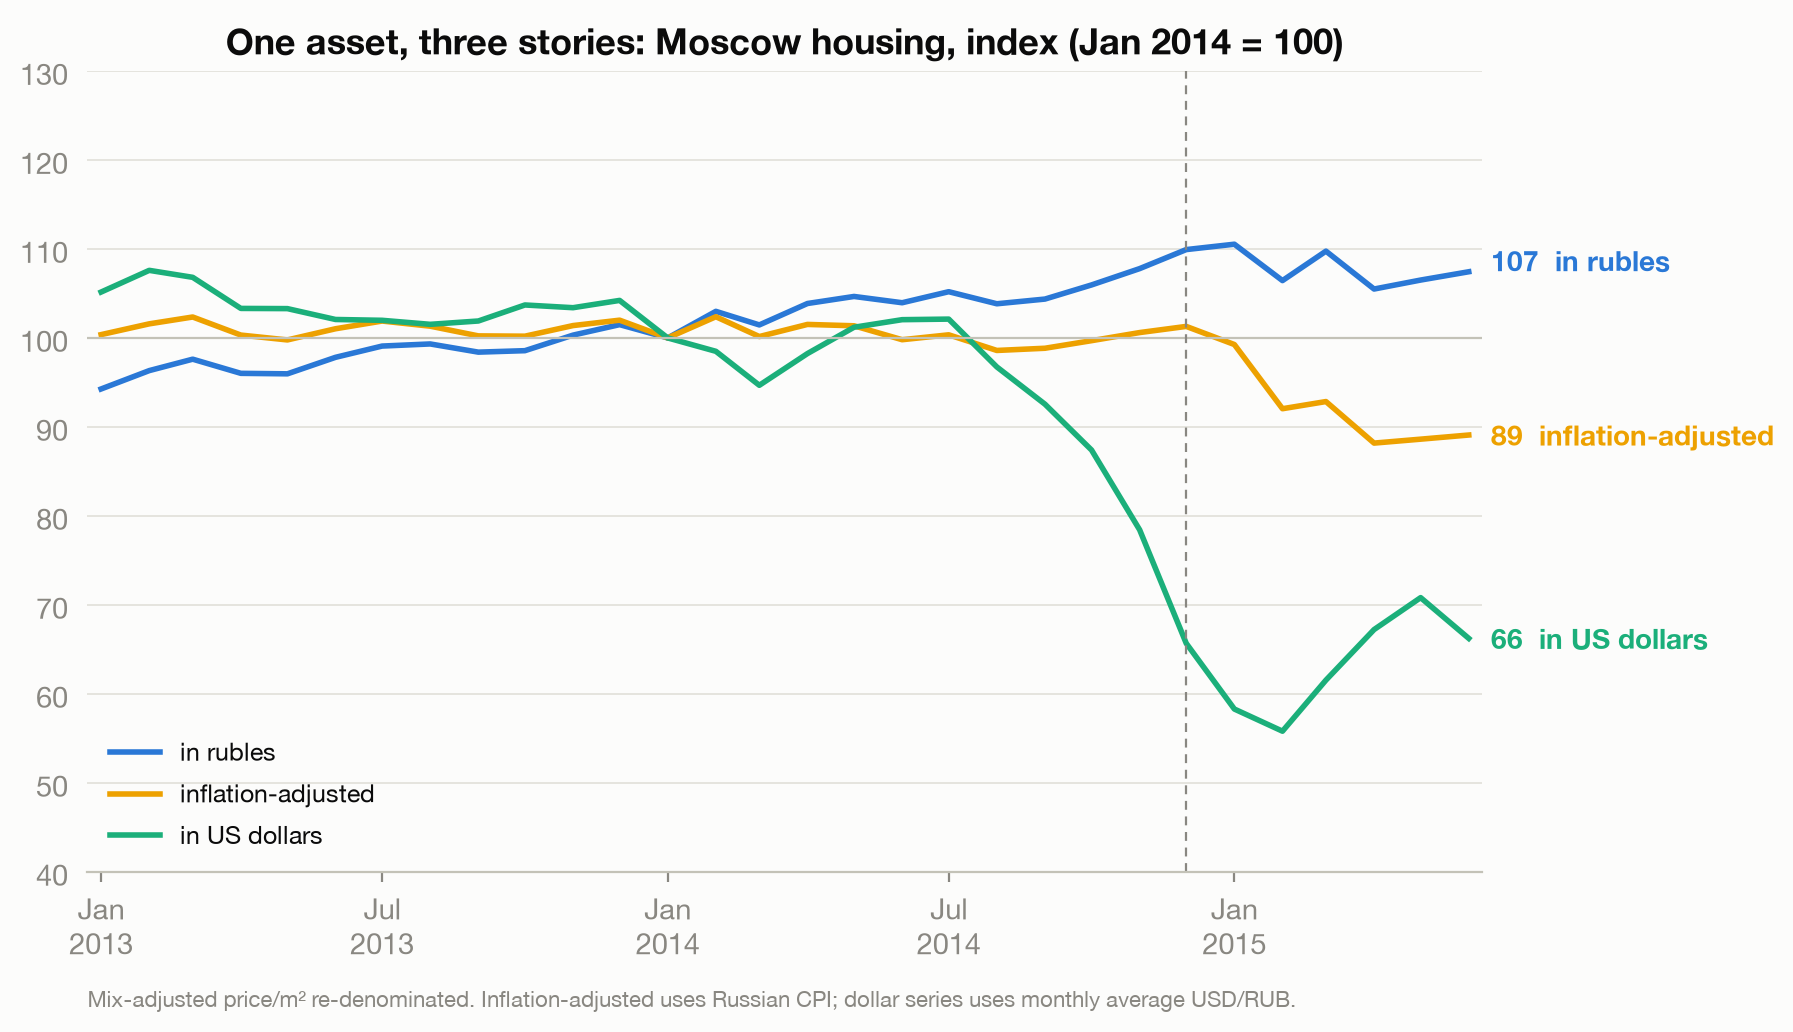
Now take the exact same price series and price it three different ways:
- In rubles: 107. Up 7%. Comfortable.
- Adjusted for Russian inflation: 89. Down 11%. Quietly shrinking.
- In US dollars: 66. Down a third, a bigger fall than the entire peak-to-trough decline of the US national home-price index after 2008 (about 27%). And nobody in Moscow felt it happen. That’s the point.
Same apartments. Same months. The only thing that changed is the ruler.
An asset priced in a falling currency can go up and lose value at the same time. “Stable” is a property of the measuring stick, not of the asset.
This is money illusion, and property is where it hides best. A dollar account shows you the damage every morning. Your house never quotes you a price, so the loss simply doesn’t exist until the day you try to sell.
”But I earn rubles”
The obvious objection: a Muscovite earns rubles, spends rubles, and retires in rubles. Who cares what the flat is worth in dollars?
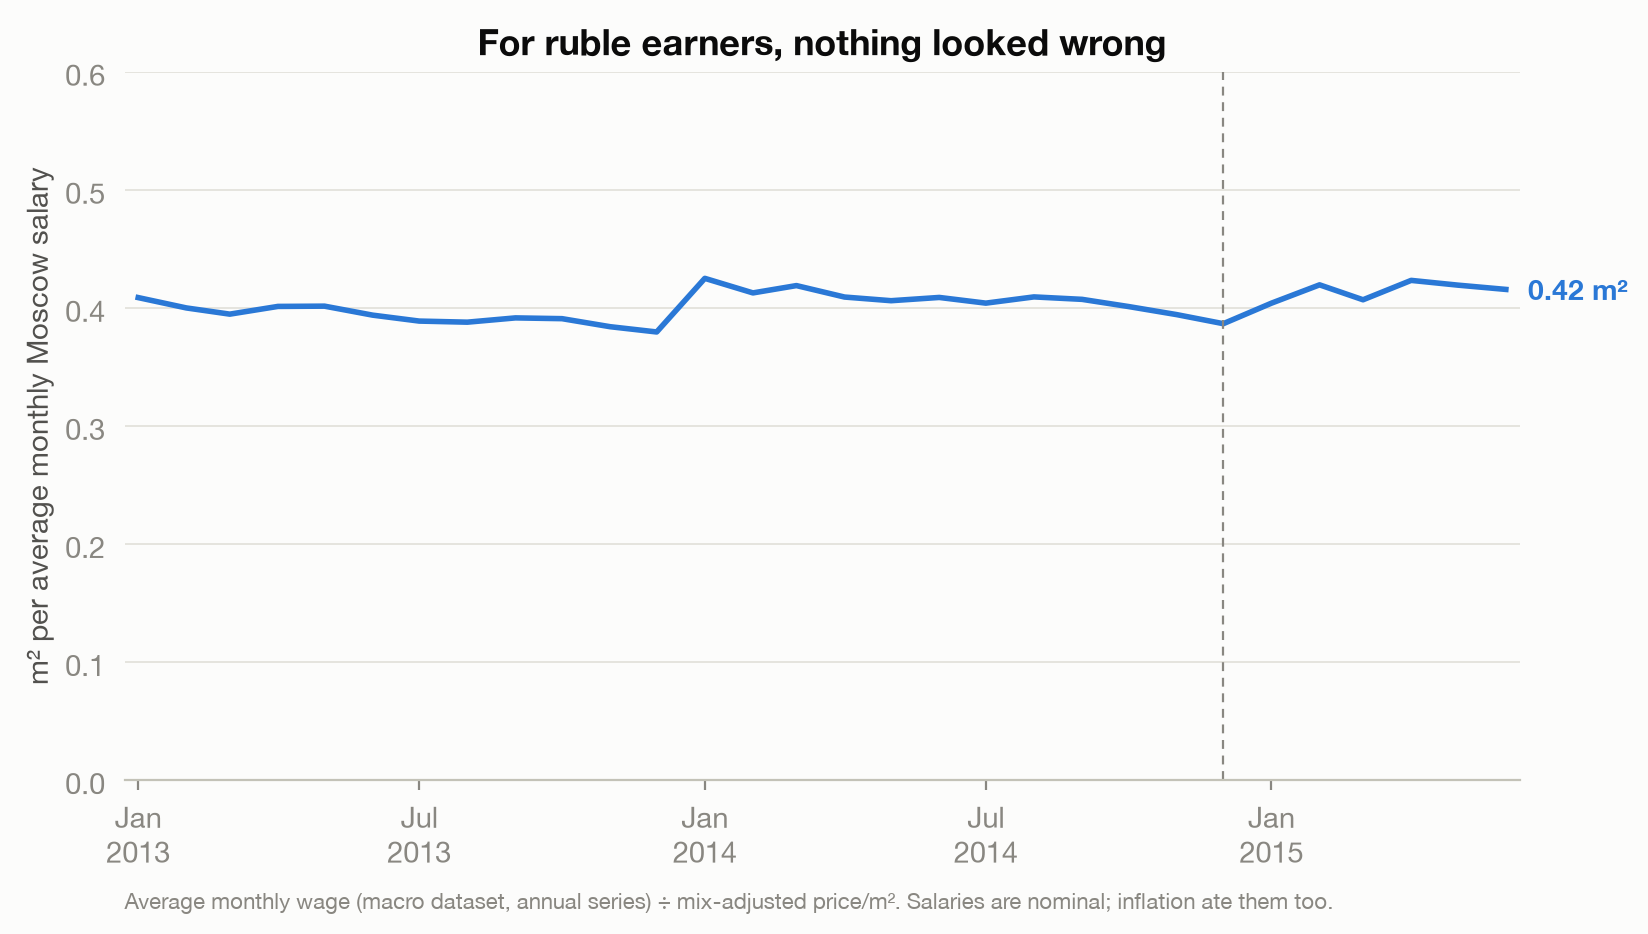
The data partly agrees. One month of the average Moscow salary bought about 0.4 square meters before the crisis and about 0.4 after it. From inside the ruble, the system looked stable; that’s precisely what makes the illusion so durable.
But there’s a crack in this comfort: between January 2014 and mid-2015, consumer prices rose about 20% while the average wage rose 5%. Flat “affordability” against a shrinking real wage isn’t stability; everyone got poorer at the same speed, and the ratio just failed to notice.
The prices were real. The market wasn’t.
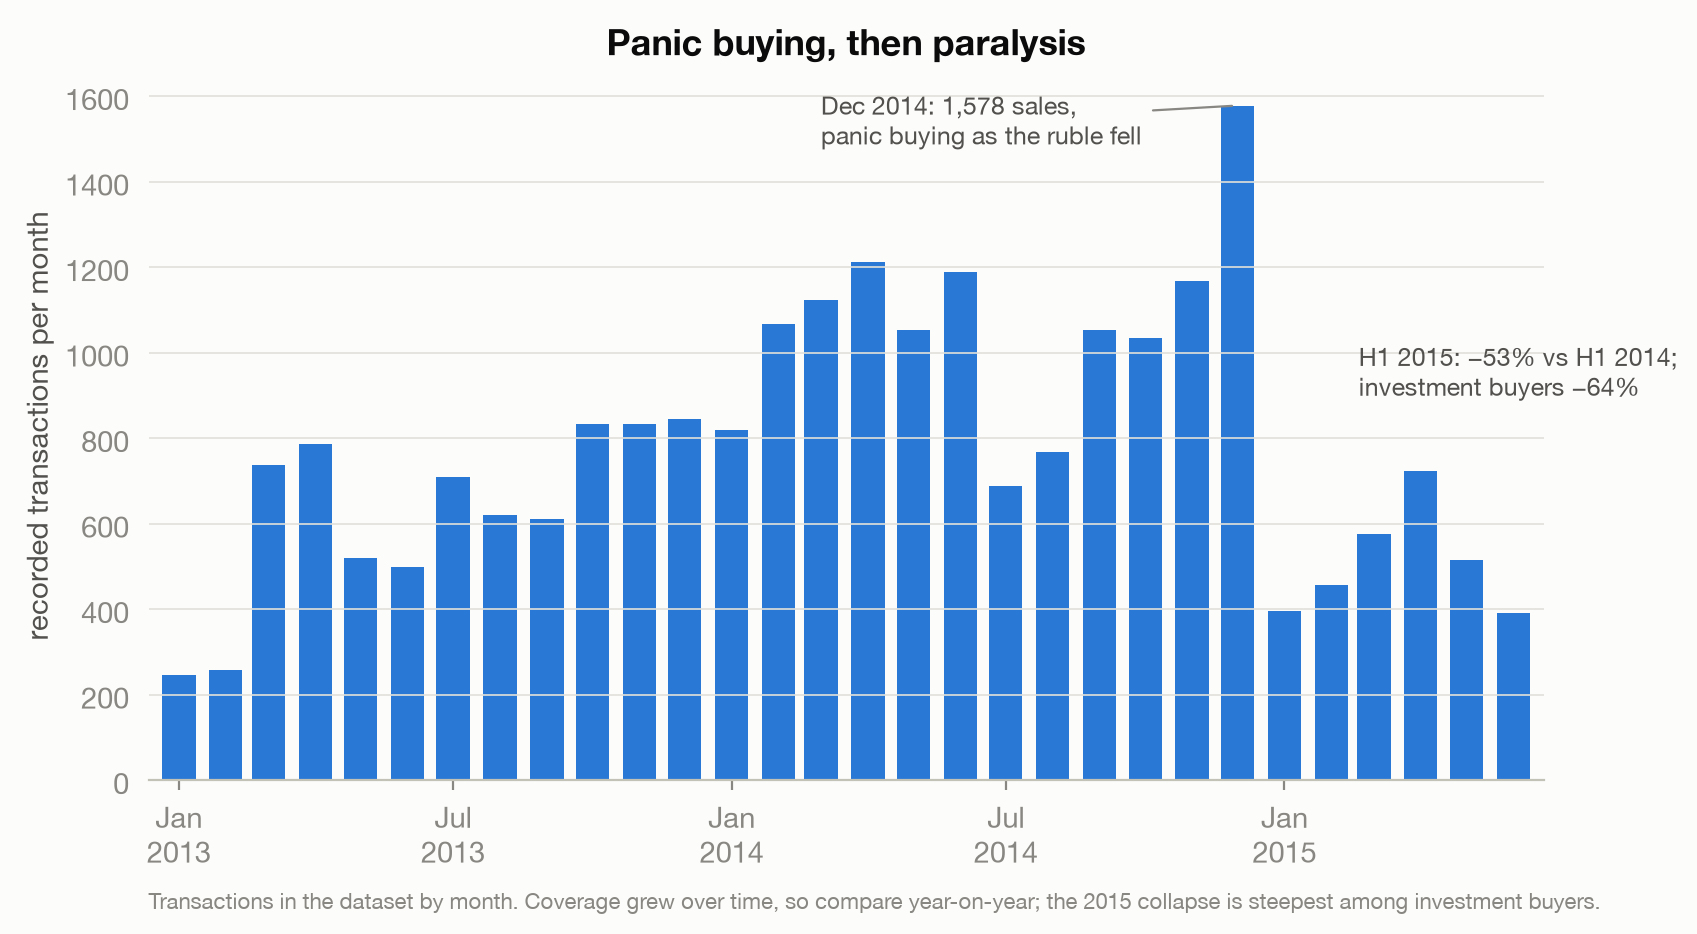
Look at December 2014, the exact month the ruble broke. It’s the busiest month in the entire dataset: 1,578 recorded sales, as people dumped rubles into concrete the way they dumped them into televisions. Then the market went quiet: the first half of 2015 runs 53% below the first half of 2014, and the collapse is steepest exactly where you’d expect: investment purchases fell 64%, owner-occupier purchases 29%. (One caveat: this dataset is Sberbank’s own book, whose coverage grew over time, so I only compare year-on-year.)
Here’s why that matters for the price chart. Every price in this data is one that somebody actually paid. But when volume halves, the prices you observe come from an unrepresentative group, the sellers who got their number. The ones who couldn’t sell at yesterday’s price simply vanish from the data. Thin markets select for good-looking prices. If anything, the +7% and the −34% are flattering: the true value of a Moscow flat you actually needed to sell in 2015 sat somewhere below the line on the chart.
What the money could have done instead
Maybe property still won by default. What were the alternatives for a Muscovite with, say, a million rubles in January 2014?
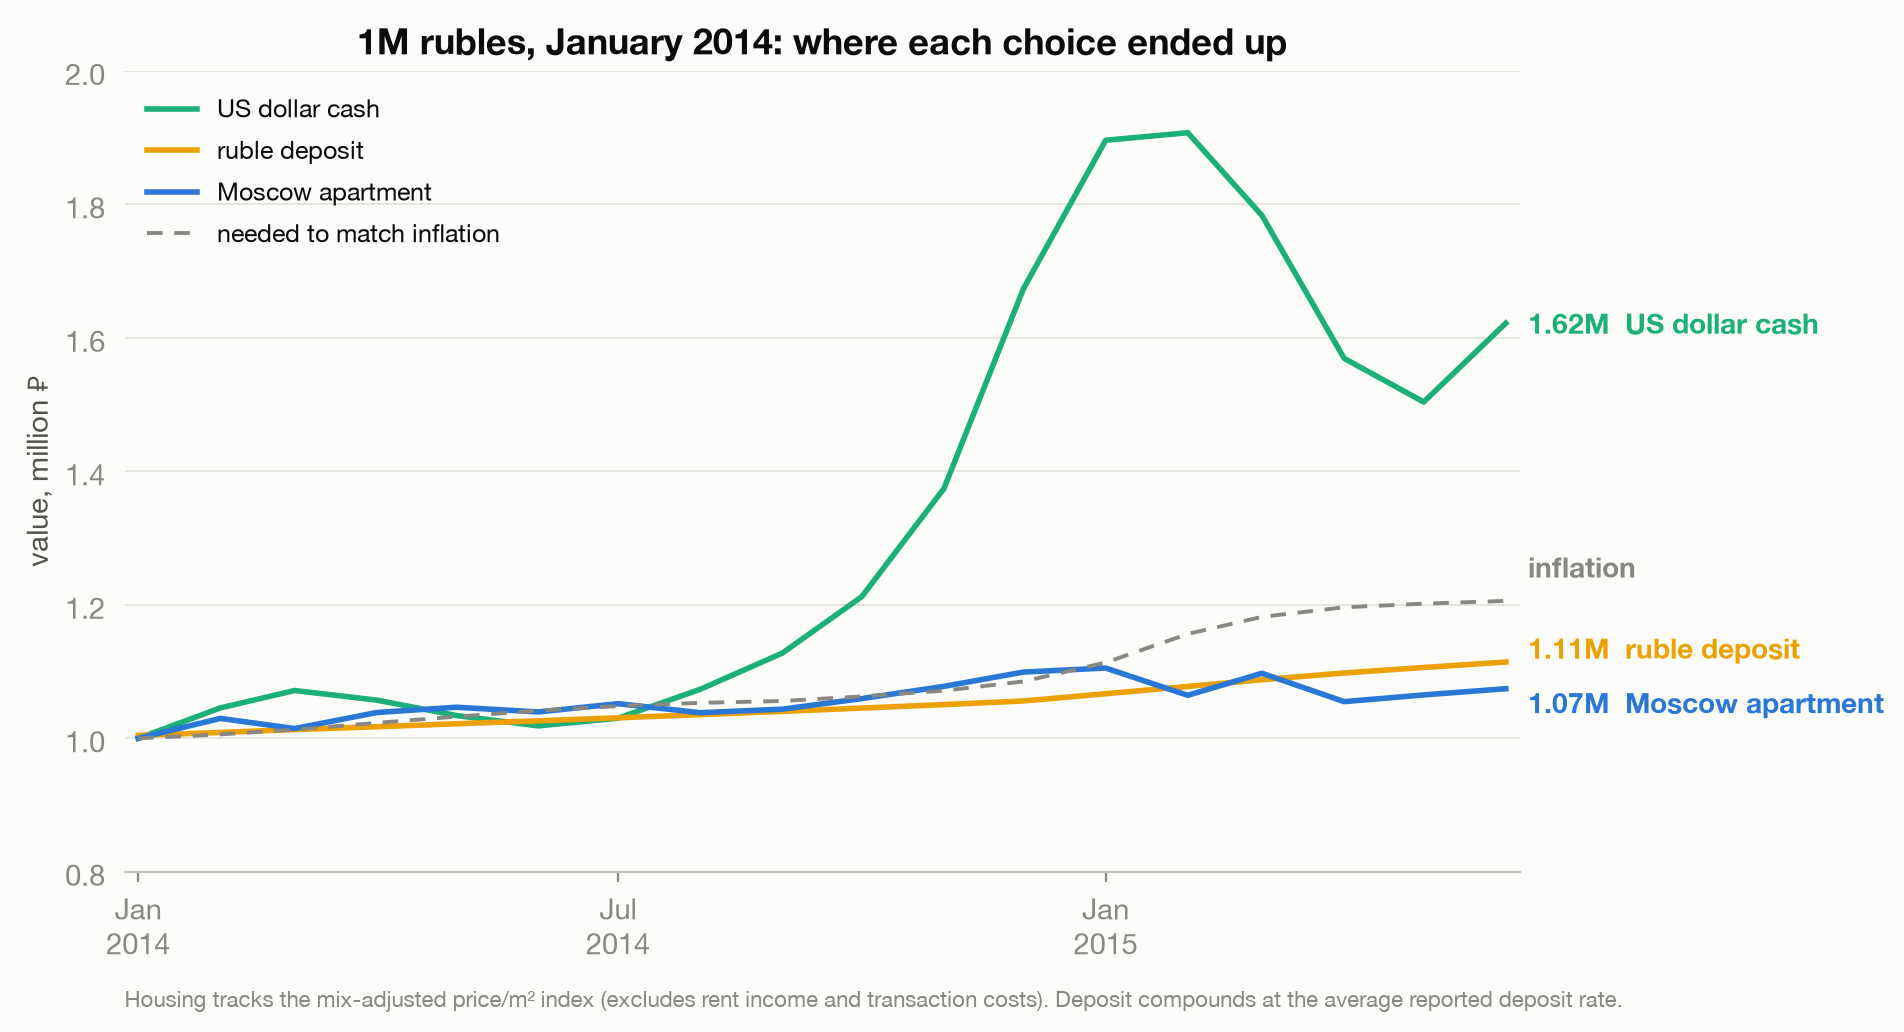
By June 2015:
- A Moscow apartment: 1.07M rubles.
- A ruble bank deposit: 1.11M. Yes, the boring deposit beat the apartment.
- US dollars in a drawer: 1.62M.
- Just keeping up with inflation required: 1.21M.
To be fair to the apartment: it could have been rented. Moscow gross yields ran somewhere around 4% a year, and eighteen months of rent puts the flat roughly level with the deposit; call it a tie, before repairs, vacancy, taxes, and the problem of selling into a market with no buyers. (The deposit also got to roll into 13% crisis rates along the way; the flat was bought once.)
The real lesson sits higher up the chart. Neither of the standard ruble choices kept up with inflation. Not the apartment, not the deposit. The only choice that preserved wealth was the one that felt reckless: leaving the local currency entirely. One honest caveat: that works in this kind of crisis, an external devaluation where the banks stay open. Argentina 2001 confiscated dollar deposits; Russia 1998 froze them. The dollar drawer wins the 2014 scenario, not every scenario.
And there’s a lever I’ve ignored so far: debt. Most people don’t buy property with cash, and a fixed-rate mortgage in your own currency is a short position against that currency. Muscovites who owed rubles watched inflation quietly eat a fifth of their debt in real terms; their flat lost 11% in real value, but so did their loan. Meanwhile the minority who had borrowed in dollars and francs, the valyutnye ipotechniki, saw their debt nearly double and became a national protest movement. Same asset, opposite outcomes. The currency of the financing mattered more than the walls.
What this means in rupiah
None of this is really about Moscow.
Indonesia ran a harsher version of this experiment in 1998, when the rupiah went from about 2,400 per dollar to past 14,000 at the worst point. And here’s the uncomfortable part: Jakarta property didn’t even manage Moscow’s trick of nominal stability. No official price index reaches back that far (Bank Indonesia’s series only starts in 2002), but the record is one of oversupply, developer collapse, and lending rates above 60%, with prices falling in nominal rupiah even as everything else inflated. Property owners lost twice: once to the market, once to the currency. Property, it turns out, has two failure modes, and 1998 Indonesia found the second one.
Gold, the third item on the list, was the one that did its job. It did the same in Moscow: flat in dollars through the crisis, which made it up more than 50% in rubles, not because gold is magic but because its price never asks your currency’s opinion.
So here’s the rule the data leaves us with. A hedge has to be denominated in the thing you will actually need. If your future is entirely in rupiah (you’ll live here, spend here, retire here), property genuinely does protect you from rent and from ordinary inflation, and 2014 Moscow would have roughly preserved your local purchasing power. But if any part of your future is priced in someone else’s currency (a child’s education abroad, medical care, imported anything, the option to leave), then land does not hedge that, no matter how solid it feels.
To be precise about what the data does and doesn’t say: over decades, property has been a fine store of wealth in both countries: Moscow flats in dollar terms rose several-fold between 2000 and 2013. What property cannot do is carry you through the devaluation event itself. And the devaluation event is exactly when you find out what your hedge is actually made of.
Tanah, rumah, emas is two-thirds of a good list. Respect the third item more, and stop confusing “priced in my currency” with “safe.”
Method notes
Data: Sberbank Russian Housing Market (Kaggle): 30,471 Moscow transactions, Aug 2011 to Jun 2015, plus a 99-series macro file (exchange rates, CPI, wages, deposit rates; the wage and CPI figures in this essay come from that file’s Moscow salary and Russian CPI series). Cleaning: dropped 1,504 declared-price rows (exactly 1M or 2M ₽), implausible areas (≤10 m² or ≥1,000 m²), and trimmed price per square meter to the 1st to 99th percentile; 28,357 transactions remain. The headline price series is a district fixed-effects index (within-district demeaned log price per square meter, averaged monthly), anchored to the January 2014 citywide median; this controls for the New Moscow composition shift, whose monthly transaction share ranges from roughly 14% to 38%; the raw citywide median (which ends 12 points lower) is in the notebook as a robustness check. Caveats: transaction mix within districts can still shift; declared prices likely understate true prices even after cleaning; dataset volume partly reflects Sberbank’s growing coverage, so volume comparisons are year-on-year; the housing counterfactual excludes rent income and transaction costs (discussed in text) while the deposit rolls monthly at prevailing rates; the gold figure combines the world dollar gold price (roughly −5% over the window) with the dataset’s exchange-rate series; the data ends June 2015, and the crisis did not.
All of the code, the cleaning, the charts, the robustness checks, and a narrated notebook that reproduces every figure, is on GitHub: github.com/joechrisnaldy/data-stories.
References
Al Jazeera. (2014, December 16). Russia raises key rate after rouble slumps. https://www.aljazeera.com/economy/2014/12/16/russia-raises-key-rate-after-rouble-slumps/
Bank of Russia. (n.d.). Key rate of the Bank of Russia [Data set]. Retrieved July 9, 2026, from https://www.cbr.ru/eng/hd_base/KeyRate/
Firman, T. (1999). From ‘global city’ to ‘city of crisis’: Jakarta metropolitan region under economic turmoil. Habitat International, 23(4), 447-466. https://www.sciencedirect.com/science/article/abs/pii/S019739759900020X
Global Property Guide. (n.d.). Gross rental yields in Russia: Moscow and 6 other cities. Retrieved July 9, 2026, from https://www.globalpropertyguide.com/europe/russia/rental-yields
Government of Moscow. (n.d.). Troitsky and Novomoskovsky administrative areas are the most rapidly developing territory of Moscow. Retrieved July 9, 2026, from https://www.mos.ru/en/news/item/26435073/
Indonesia Investments. (n.d.). Asian financial crisis of 1997: Analysis of causes and lessons. Retrieved July 9, 2026, from https://www.indonesia-investments.com/culture/economy/asian-financial-crisis/item246
NBC News. (2014, December 17). Facing crisis, Russians who can afford it are going shopping. https://www.nbcnews.com/news/world/facing-crisis-russians-who-can-afford-it-are-going-shopping-n270216
Organisation for Economic Co-operation and Development. (2026). Currency conversions: US dollar exchange rate: Average of daily rates: National currency: USD for Russia [CCUSMA02RUM618N] [Data set]. FRED, Federal Reserve Bank of St. Louis. Retrieved July 9, 2026, from https://fred.stlouisfed.org/series/CCUSMA02RUM618N
S&P Dow Jones Indices LLC. (2026). S&P CoreLogic Case-Shiller U.S. National Home Price Index [CSUSHPINSA] [Data set]. FRED, Federal Reserve Bank of St. Louis. Retrieved July 9, 2026, from https://fred.stlouisfed.org/series/CSUSHPINSA
Sberbank. (2017). Sberbank Russian housing market [Data set]. Kaggle. https://www.kaggle.com/c/sberbank-russian-housing-market
Trading Economics. (n.d.). Urals oil [Data set]. Retrieved July 9, 2026, from https://tradingeconomics.com/commodity/urals-oil
World Gold Council. (n.d.). Gold prices [Data set]. Retrieved July 9, 2026, from https://www.gold.org/goldhub/data/gold-prices
// About the author
Jonathan Chrisnaldy is a product manager and analyst in New York City, with an M.S. in Technology Management from Columbia University. He writes data stories about the numbers behind everyday claims. More on the experience page or LinkedIn.